Bangalore
From 2007.igem.org
The official wiki of the NCBS iGEM 2007 Team
Contents |
The Company
|
|
|
The Mission
To investigate multistability and hysteresis in combinatorially constructed synthetic Vibrio quorum sensing circuits
The Target - Vibrio Quorum Sensing System
Quorum sensing is a phenomenon by which bacteria sense a critical cell density before turning on the expression of certain genes. It involves the gradual build-up of a chemical termed the 'autoinducer' in the cell. The autoinducer freely diffuses across the cell membrane and hence, its concentration is population density dependent. When the concentration crosses a threshold, the bacteria switch to a different physiological state such as bioluminescence, virulent gene expression, and bio-film formation.
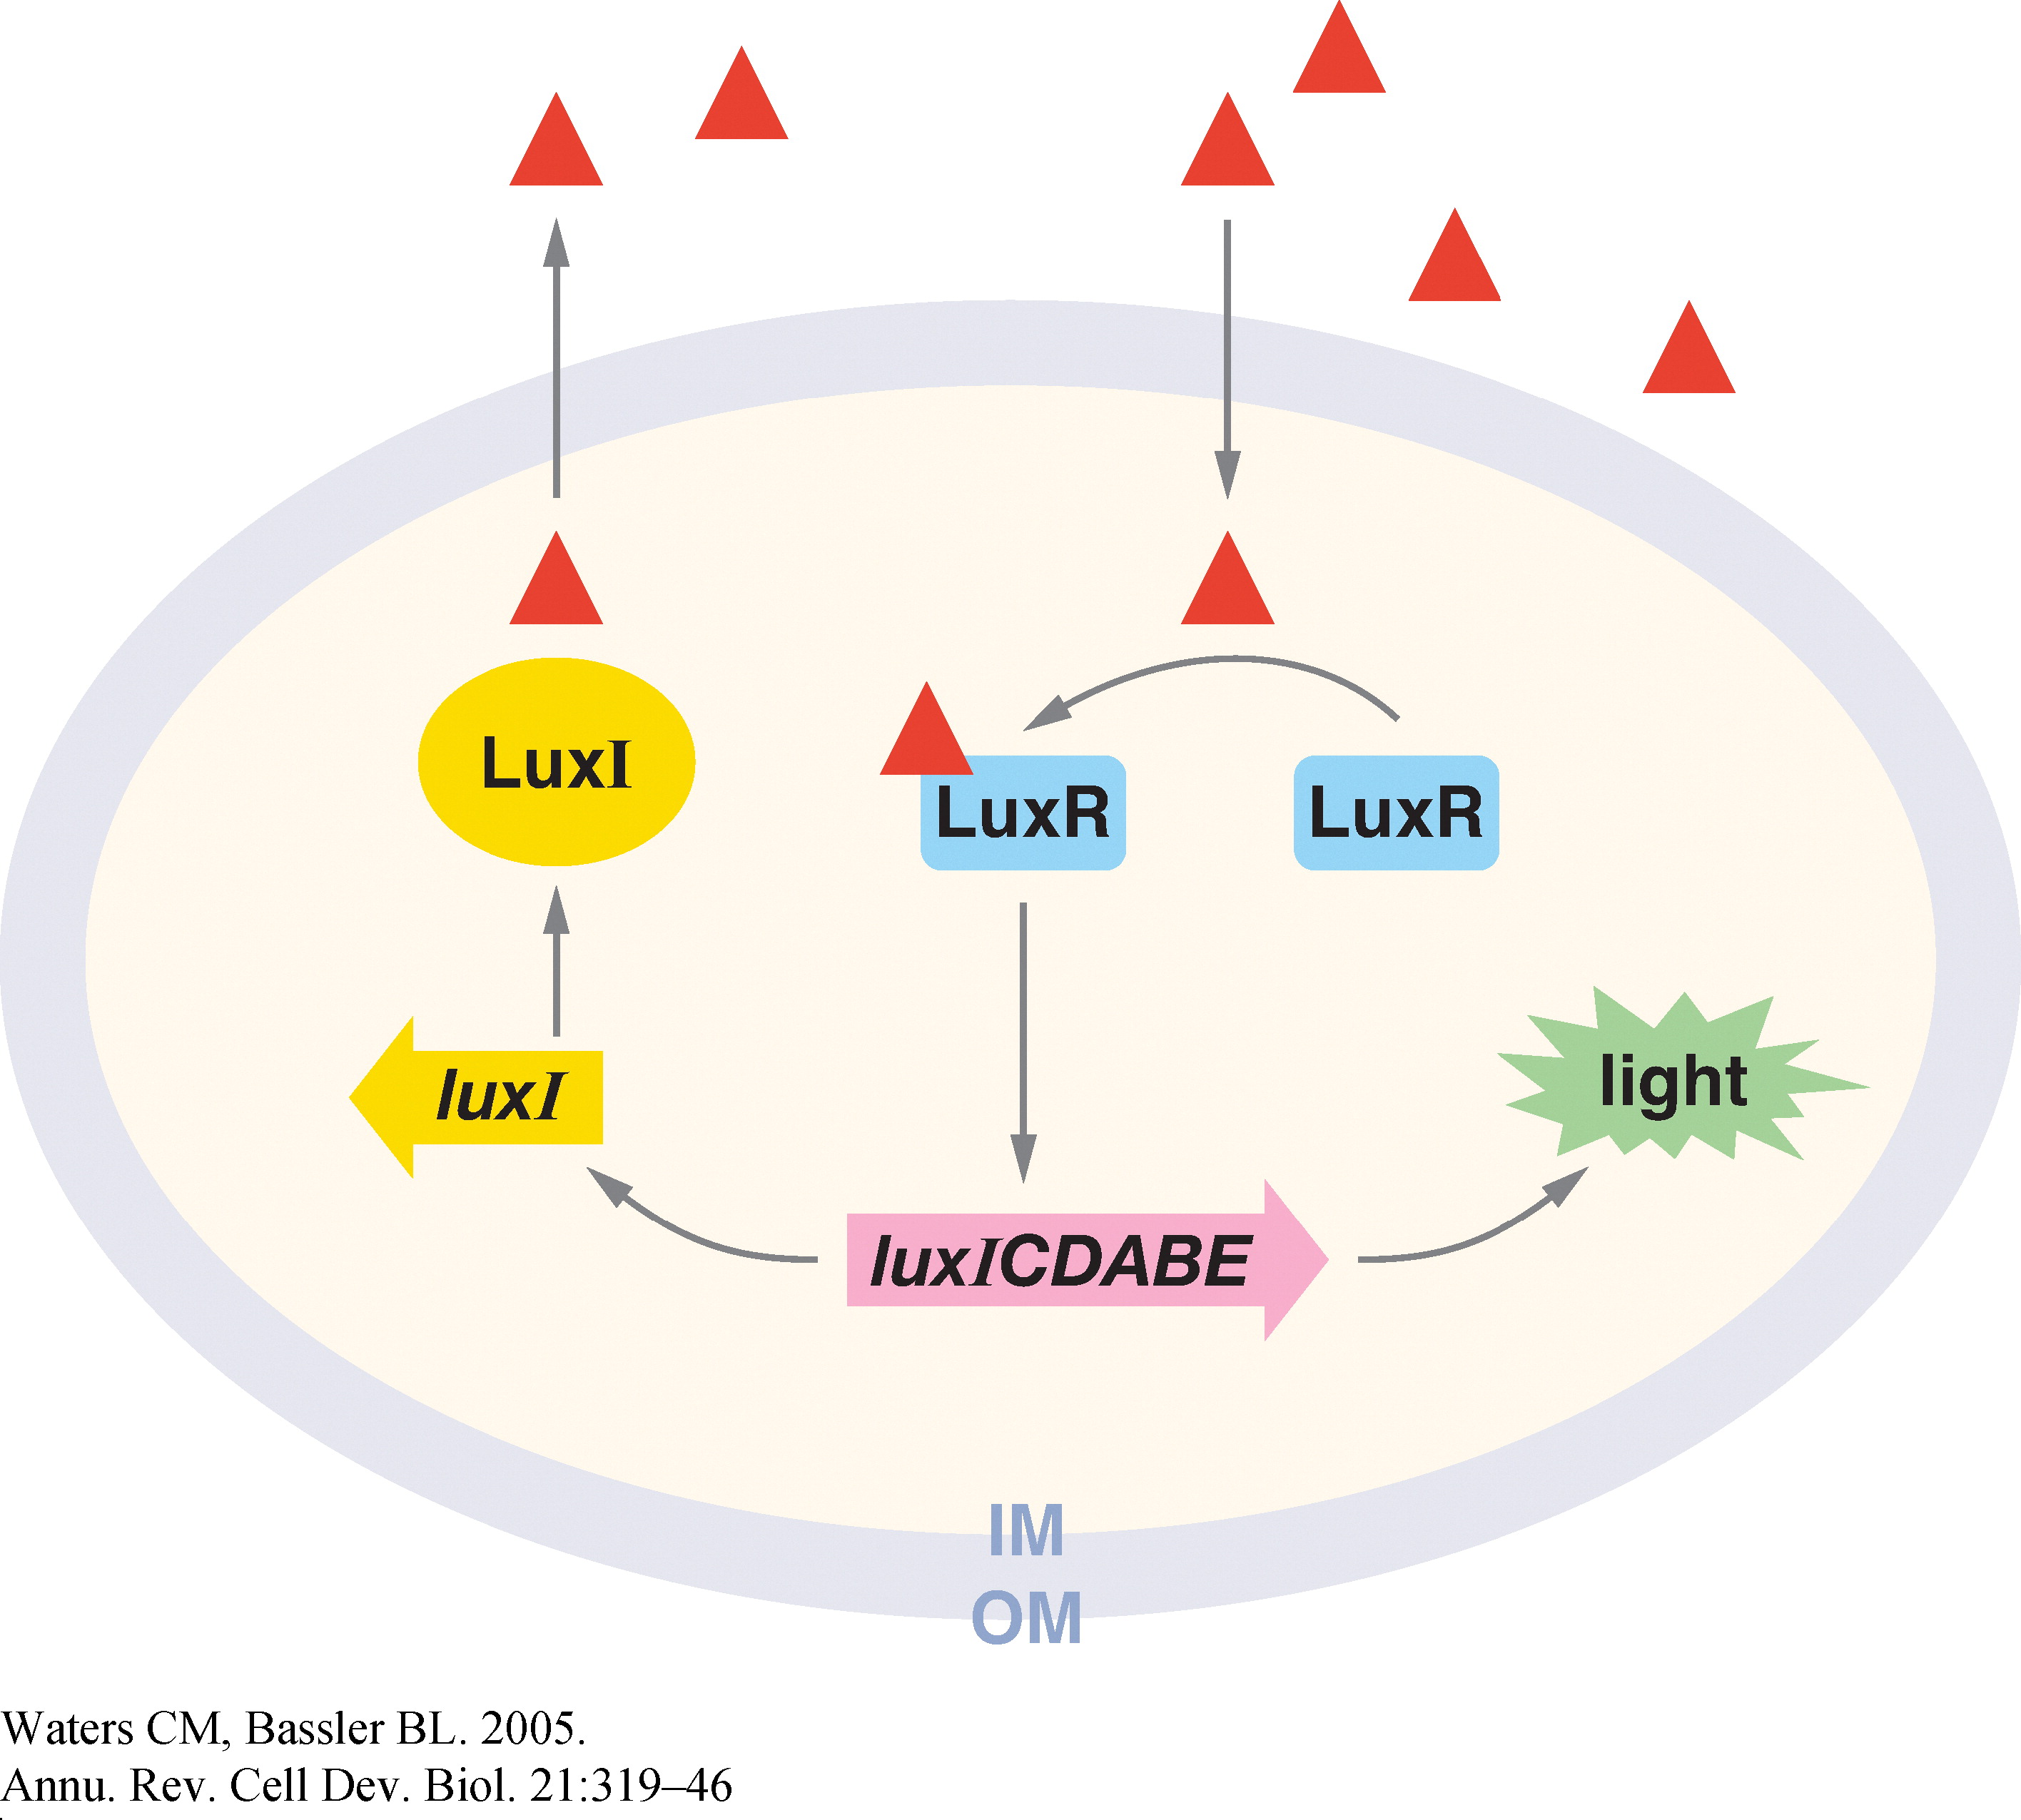
In Vibrio fischeri, when the population density (and hence the concentration of autoinducer) crosses a certain threshold, the expression of a set of genes that is required for bioluminescence is turned on. The production of the autoinducer is under the control of a gene, the expression of which involves positive feedback. Figure 1 shows the various components of this system (Ref. 1).
View a powerpoint presentation. Click here.
Why did we pick this system?
The Vibrio quorum sensing system involves a well-defined set of genes and a promoter, and has a degree of complexity that offers wide scope for exploration. Additionally, the concentration of the active transcriptional regulator, LuxR* is dependent on 3 factors: i) The concentration of LuxI ii) The population density iii) The concentration of LuxR
All these factors can be experimentally controlled. Thus, the nature of the system offers one an extremely good handle on the feedback strength of the genetic circuit.
A note on Multistability and Hysteresis
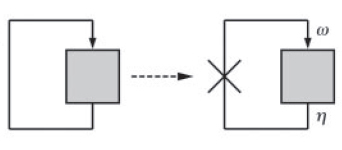
A simple graphical method can be used to deduce the stability behaviour of such systems (Ref. 2). The key feature of this approach is to view the positive feedback system as a feedback closure of its corresponding 'open loop' system. This open loop system is obtained by breaking the feedback loop at the point of feedback (Fig. 2).
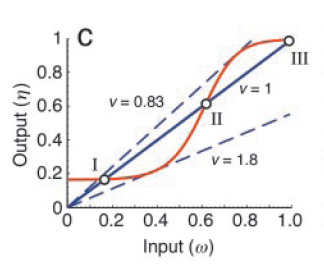
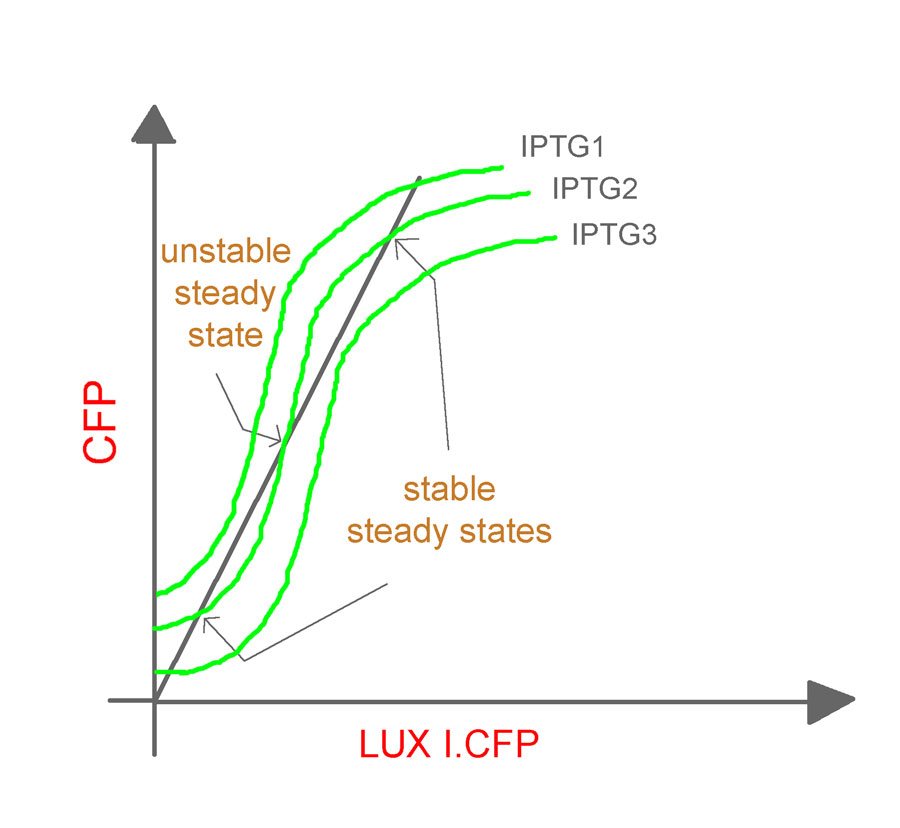
Now, one can experimentally manipulate the amount of input (ω) and monitor the output (η) as a function of ω. The fixed points of the corresponding closed loop system are then obtained by intersecting η = f (ω) with the straight line, η = (1/ν) ω, where ' ν ' is the feedback strength. At these points of intersection, the open loop system exactly mimics the closed loop system. As shown in Fig. 3, they represent two stable steady states (I and III) and one unstable steady state (II).
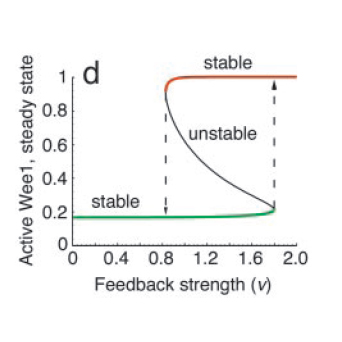
All positive-feedback, multistable systems show the associated property of hysteresis. This can be explained by analysing the corresponding bifurcation diagram, which is a plot of the steady states as a function of the feedback strength (see Fig. 4). To do this, one can vary the feedback strength, ‘ν’ and find the different points at which the I/O characteristic curve intersects the equivalence line η = (1/ν) ω. At high and low feedback strength values, the system is monostable whereas in the intermediate region, there are three intersections, one associated with an unstable state and the other two with stable states.
The bifurcation diagram clearly shows the hysteretic (i.e history-dependent) behaviour of the system in the bistable region. Increasing ν from low to high results in picking the lower branch in the bistable regime, whereas decreasing from high to low takes the system to the upper branch.
Our Approach
We plan to conduct experiments to explore the multistability of our synthetic genetic circuits by using the approach described by Angeli et al. We use a positive-feedback system, whose open loop can be closed in two different ways (Fig. 5).
The transcriptional regulator, LuxR* governs the expression of the promoter, pR. Since the concentration of LuxR* depends on the concentrations of both AI and LuxR, we have a remarkable handle on the feedback. Hence, we look for bistability by varying the concentrations of AI and LuxR and shifting our I/O characteristic curves to intersect the equivalence η = ω (ν=1) line at various points. In contrast, Angeli et al varied the feedback strength (ν) values to explore bistability in their numerical simulations.
The Parts
I Promoters:
- pR
- pLac
- pTet
II Regulator:
- LuxR
III Signalling:
- LuxI --> AI
IV Inducers:
- IPTG (Isopropyl β-D-1-thiogalactopyranoside)
- aTc (anhydro tetracycline)
IV Reporters:
- CFP (C)
- YFP (Y)
The Main Constructs
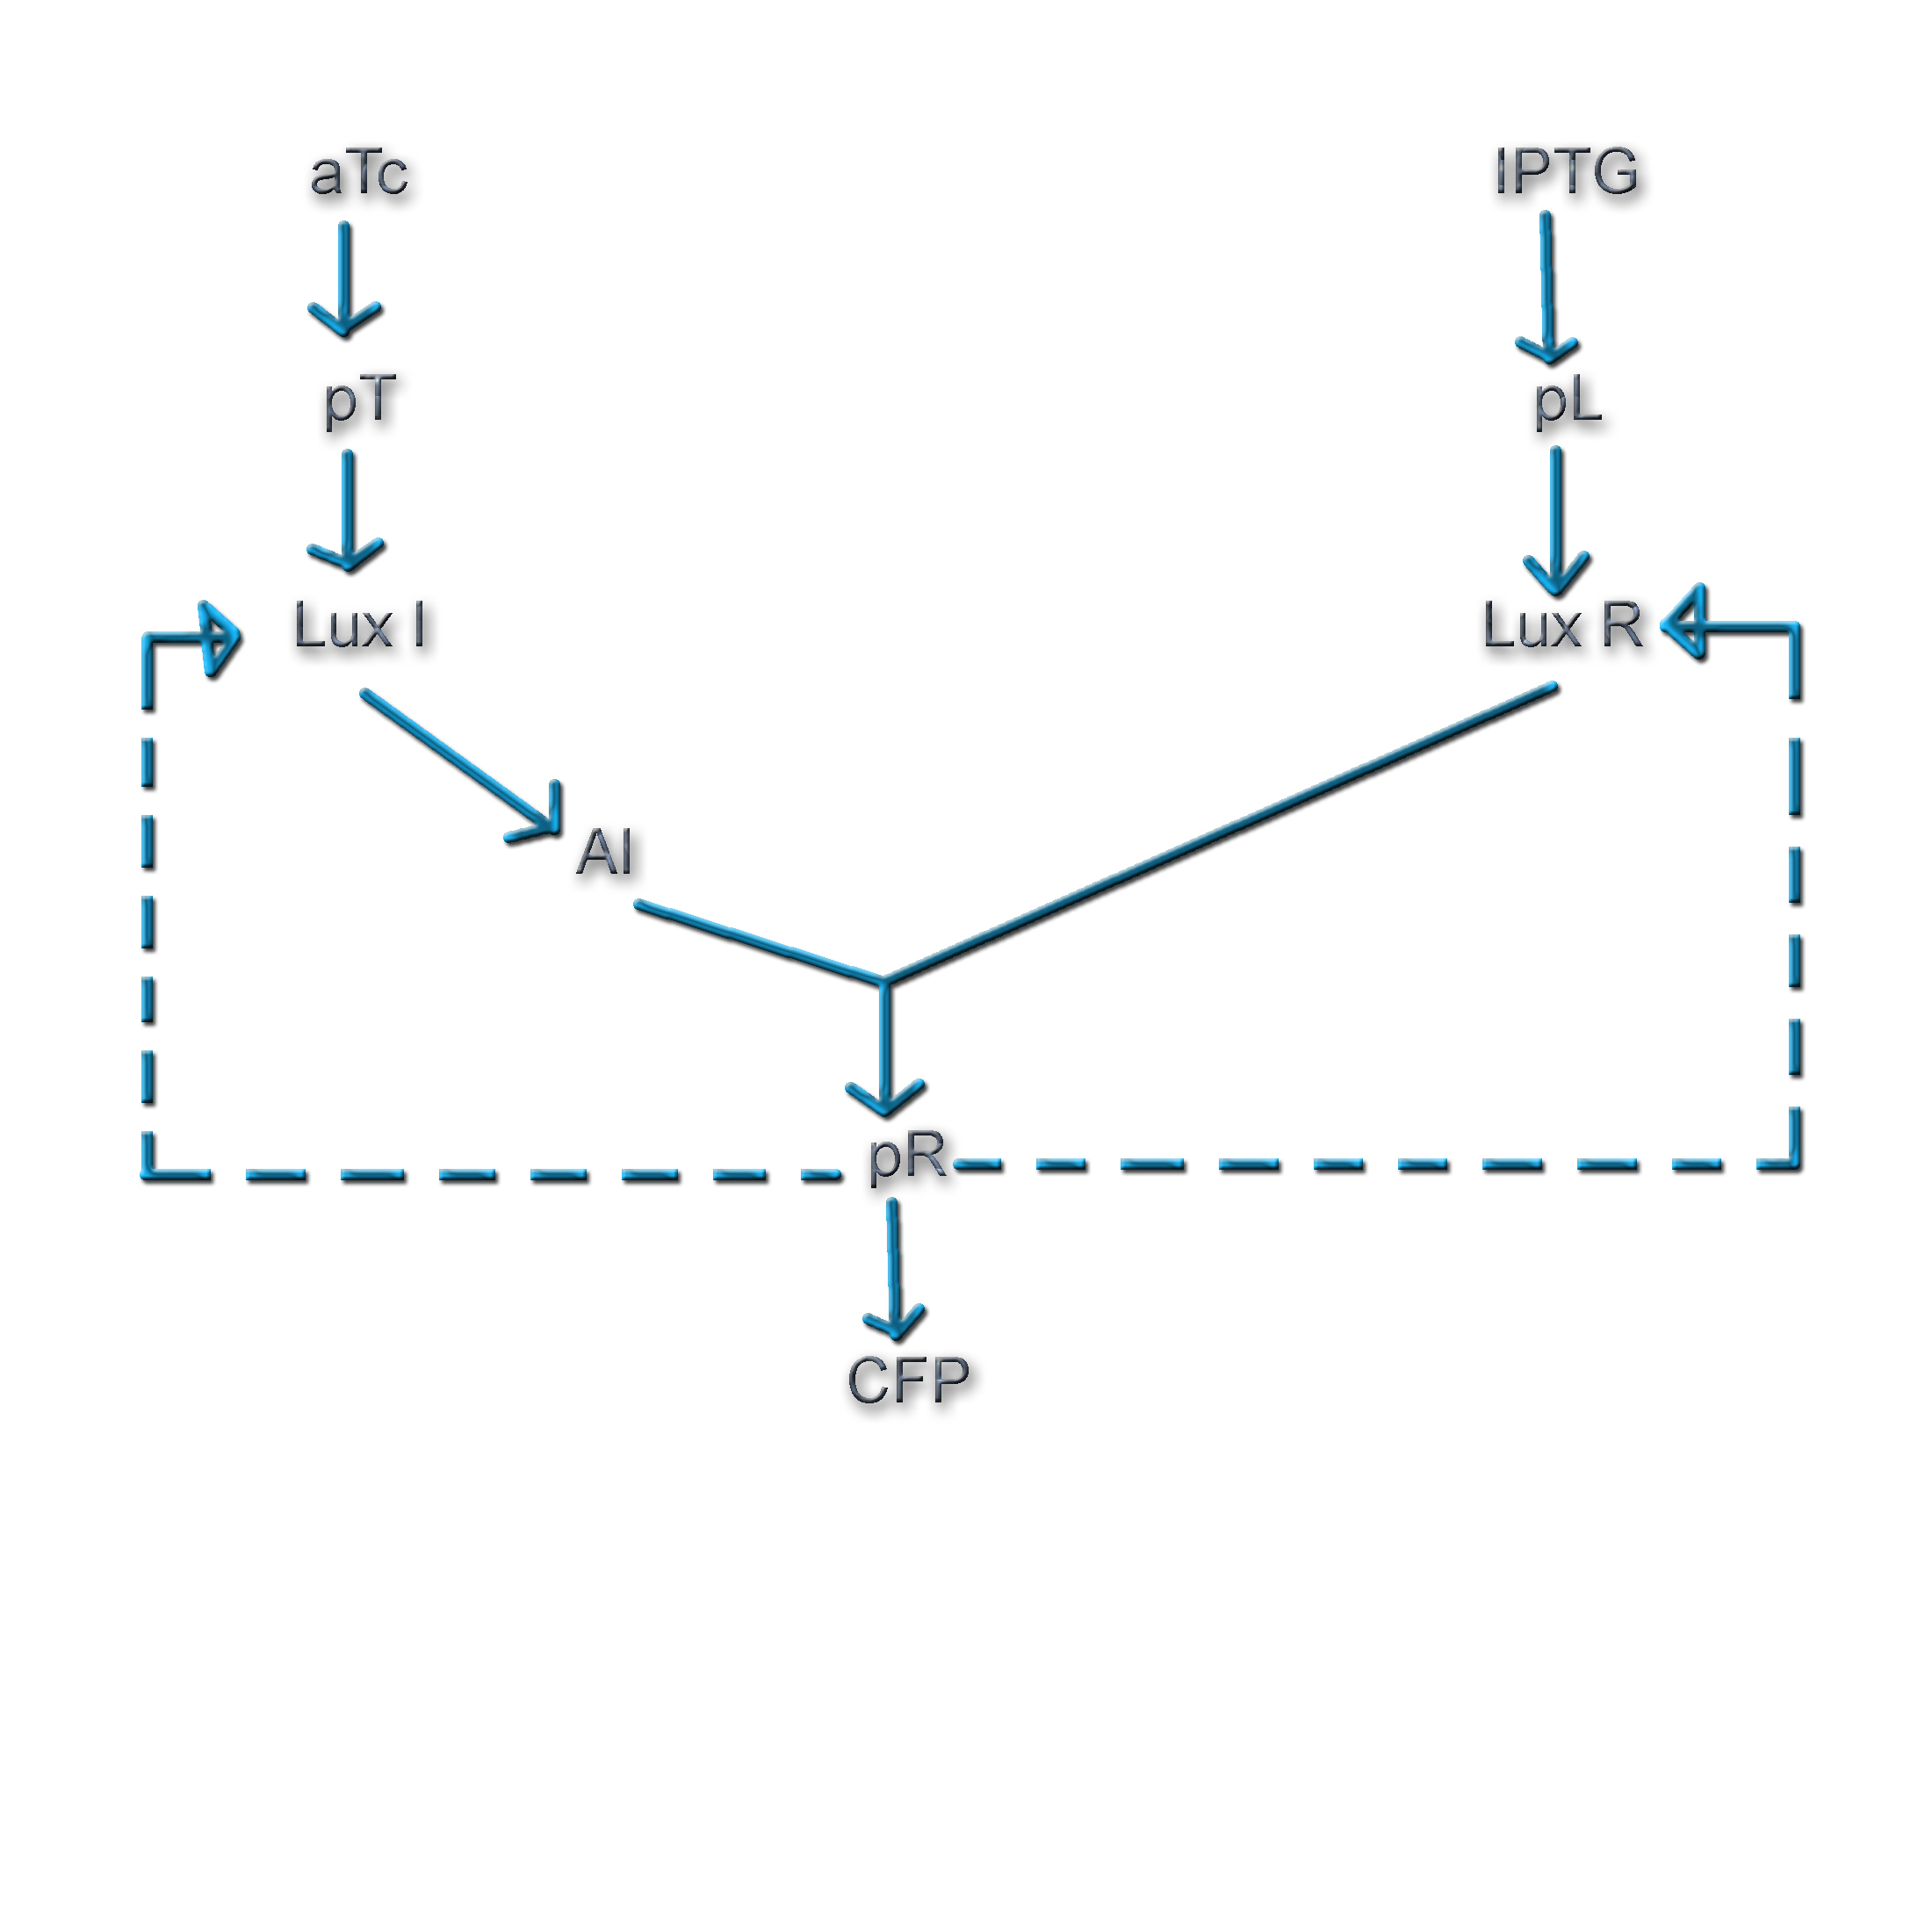
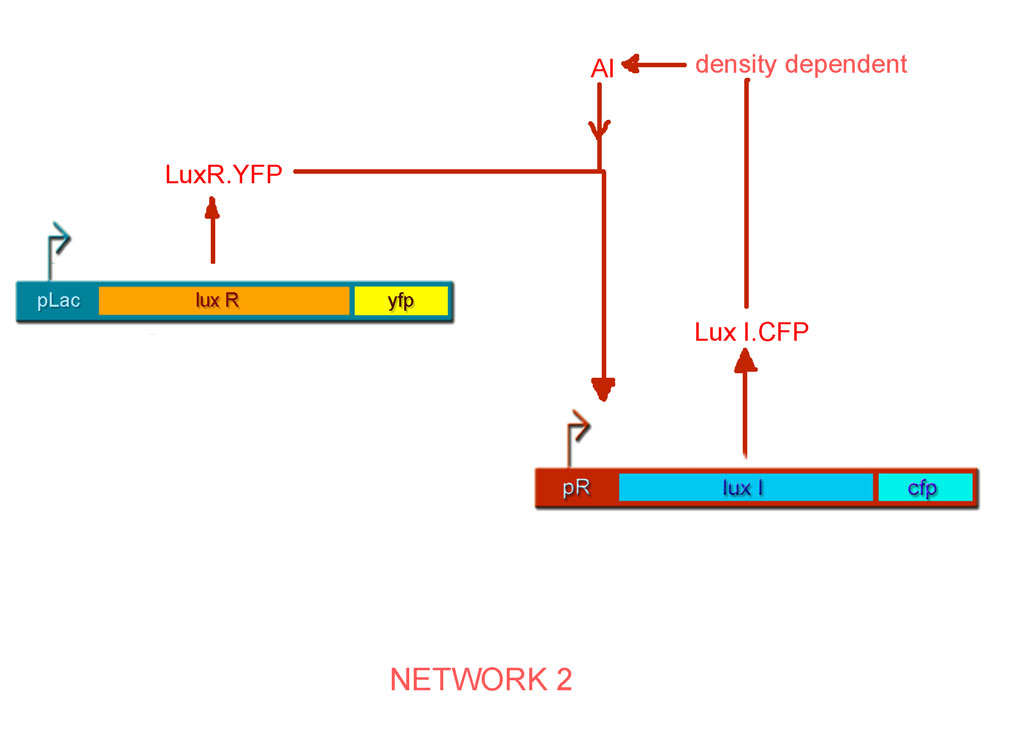
By combinatorial construction, we have used our network parts to design two positive feedback systems (Figs. 6 & 7).
The feedback-blocked, open loop system for both the systems can be represented by using the following two constructs.
- pTet LuxI.cfp
- pLac LuxR.Y pR cfp
Experiments Designed
We break the closed loop of network 1 as shown in the Fig. 7.
The open-loop system for Network 1
- The feedback step involving production of LuxR from the pR promoter is broken and in its place, LuxR is placed under the regulation of the pLac promoter and the CFP gene is placed under the regulation of the pR promoter.
- Cells containing the construct pTet luxI.cfp will be initially cultured at a desired aTc concentration (to drive the production of a desired concentration of AI by inducing LuxI expression) at a particular density. The cells will then be separated by centrifugation and the medium containing AI will be added to the growth medium of the cells hosting the construct pLac luxR.yfp pR cfp
- The fluorescent intensities of the reporter proteins (LuxR.YFP and CFP) will then be obtained using FACS, which will now, correspond to a single aTc concentration and cell density.
- The experiments will be repeated for varying values of aTc concentrations and cell densities to obtain a family of curves relating the CFP and LuxR.YFP as shown (Fig. 8).
It should be noted that, the O/P (which is fed back as the I/P) in the closed-loop system is different from its counterpart in the open-loop system. In the former, it is LuxR.YFP and in the latter, it is CFP. Hence, an equivalence line (shown in the figure as an inclined dark line), which relates LuxR.YFP and CFP, needs to be obtained.
The induction of the constructs, pLac luxR.yfp pR cfp and pLac cfp at various concentrations of IPTG will yield us different O/P intensities of CFP and LuxR.YFP for different IPTG concentrations. The expression levels for the two genes (quantified by the fluorescent intensities) at various IPTG concentrations can now be plotted to give the equivalence line. The equivalence line thus generated when superimposed on the family of curves obtained from the open-loop system will give the steady states for the system. Conclusions regarding the stability of the states will be based on the theorem proposed by Angeli et al.
It has to be noted that, the expression levels of luxI.cfp driven in the open loop will be different from that in the closed loop as they are under two different promoters. Hence, in order to obtain an equivalent concentration of aTc that will give the same expression levels as that of a particular IPTG concentration, we will require an equivalence curve between aTc and IPTG. This will be obtained by inducing the following constructs with varying concentrations of IPTG and aTc.
1. pLac luxI.cfp
2. pTet luxI.cfp
The Scaling Argument and its requirement
The production of AI is dependent on both LuxI expression and cell density. If the relationship among the three is known, one can achieve various concentrations of AI by sweeping through one of the parameters alone (LuxI or cell density). One can safely assume that at constant LuxI, the amount of AI produced is linearly proportional to cell density and vice-versa. Hence,
AI = α LuxI * ρ where, α --> constant ρ --> cell density
To prove the scaling argument, we find the CFP intensities corresponding to a particular concentration of AI at various aTc concentrations and cell densities. Subsequently, we verify that when the product of cell density and concentration of LuxI is the same in 2 trials, the amount of AI being produced is also the same.
Characterisation of Network 2
The plot for the open loop system in this case can be obtained from the open-loop system of Network 1 by fixing IPTG as the parameter and aTc as the variable input, so that we get the following family of curves (Fig. 9).
The steady states can then be obtained as described previously.
e-notebook
| May 07 | June 07 | July 07 | ||||||||||||||||||||||||||||||||
|---|---|---|---|---|---|---|---|---|---|---|---|---|---|---|---|---|---|---|---|---|---|---|---|---|---|---|---|---|---|---|---|---|---|---|
| S | M | T | W | T | F | S | S | M | T | W | T | F | S | S | M | T | W | T | F | S | ||||||||||||||
| 1 | 2 | 3 | 4 | 5 | 1 | 2 | 1 | 2 | 3 | 4 | 5 | 6 | 7 | |||||||||||||||||||||
| 6 | 7 | 8 | 9 | 10 | 11 | 12 | 3 | 4 | 5 | 6 | 7 | 8 | 9 | 8 | 9 | 10 | 11 | 12 | 13 | 14 | ||||||||||||||
| 13 | 14 | 15 | 16 | 17 | 18 | 19 | 10 | 11 | 12 | 13 | 14 | 15 | 16 | 15 | 16 | 17 | 18 | 19 | 20 | 21 | ||||||||||||||
| 20 | 21 | 22 | 23 | 24 | 25 | 26 | 17 | 18 | 19 | 20 | 21 | 22 | 23 | 22 | 23 | 24 | 25 | 26 | 27 | 28 | ||||||||||||||
| 27 | 28 | 29 | 30 | 31 | 24 | 25 | 26 | 27 | 28 | 29 | 30 | 29 | 30 | |||||||||||||||||||||
References
1. Christopher M. and Bonnie L. (2005). Quorum Sensing: Cell-to-Cell Communication in Bacteria. Annu. Rev. Cell Dev. Biol., 21, 319–46.
2. David Angeli, James E. Ferrell, Jr., and Eduardo D. Sontag (2004). Detection of multistability, bifurcations, and hysteresis in a large class of biological positive-feedback systems. PNAS, 101, 1822 – 1827.
