June 25
From 2007.igem.org
Back to Bangalore
Back to e-Notebook
Contents |
Experiments
Microscopy
- pL.CFP imaging done at various IPTG concentrations after 12 hours
- K12Z1 imaging done at 0 IPTG concentration
- pL.YFP imaging done at 50 & 1000 IPTG concentrations after 12 hours
Analysis
Microscopy
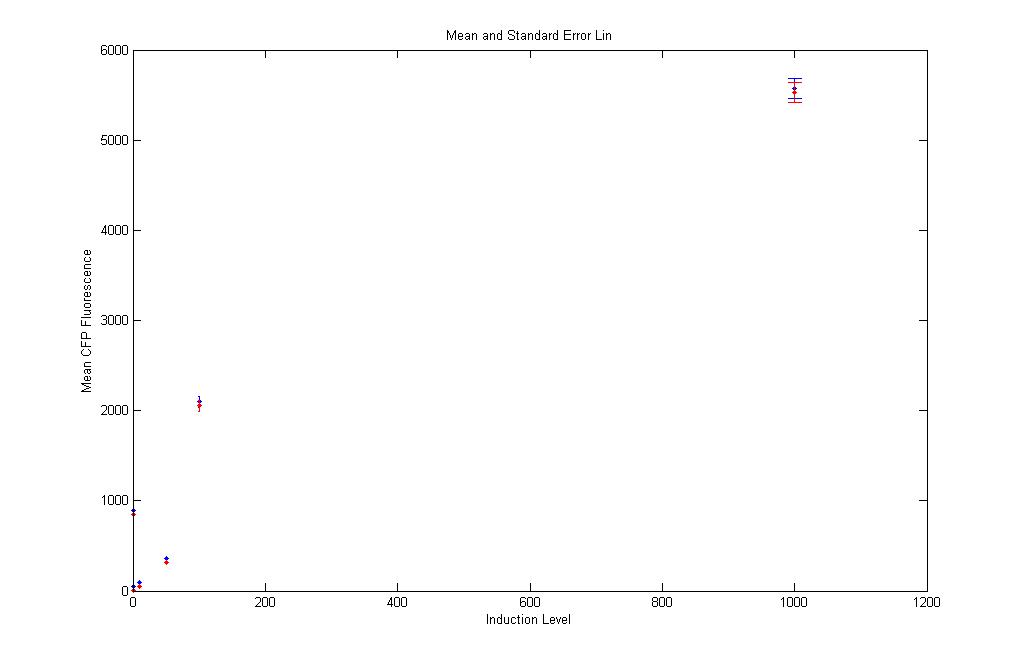
Mean and Standard Error Plots at all induction levels
- pL.CFP: Subtract K12Z1 and plot Mean CFP vs IPTG concentration
- Blue : Mean pL.CFP Fluorescence values at different ITPG concentrations
- Red : Mean pL.CFP - K12Z1 Fluorescence values at different ITPG concentrations
Linear space
|
Also, the Blue and Red points almost form a sigmoid, except for the value at 1 IPTG(???). Yippie, something we expected. |
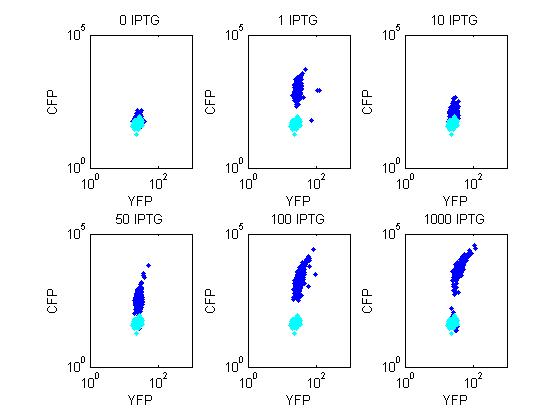
Scatter Plots
- The Scatter plots show CFP values of each cell against their corresponding YFP values. Each dot represents a cell.
- CYAN : K12Z1 Fluorescence values at no ITPG concentration
- Blue : pL.CFP values at each ITPG concentrations
|
The K12Z1 dot (cyan) show the control experiment performed. The blue dots, due to pL.CFP, show expected rise in CFP fluorescence with increase in IPTG, except for some strange thing happening at 1 IPTG(???). |

