Berkeley LBL/Results
From 2007.igem.org
< Berkeley LBL
Revision as of 21:55, 26 October 2007 by KonniamChan (Talk | contribs)
| Home | Project Description | Methods | Notebook | Results and Discussion | Resources |
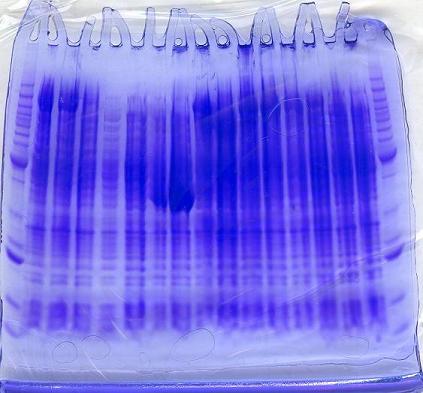
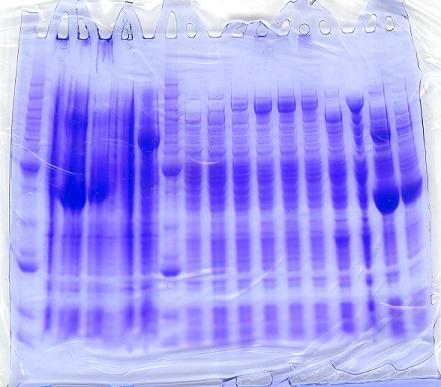
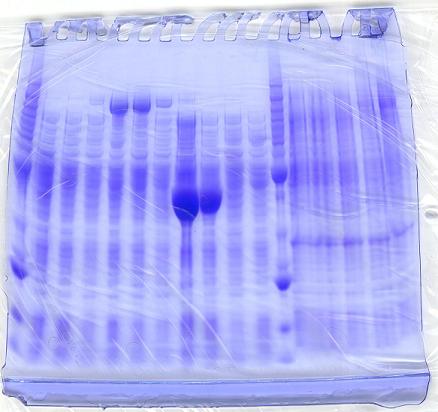
Invitrogen BenchMark Protein Ladder
| Band | kDa
| |
|---|---|---|
| row 1, cell 1 | row 1, cell 2 | row 1, cell 3 |
| row 2, cell 1 | row 2, cell 2 | row 2, cell 3 |
BAND kDa
      1        220
      2        160
      3	120
      4	100
      5	90
      6	80
      7	70
      8	60
      9*	50
      10	40
      11	30
      12	25
      13*	20
      14	15
      15	10
- NOTE: 50 and 20 kDa bands are darker intensity to serve as orientation bands.


