Click here to see them
From 2007.igem.org
(Difference between revisions)
| Line 1: | Line 1: | ||
| - | We imported the data from ''luciferase assay'' in Matlab and then we interpolated them usic a cubic spline. | + | We imported the data from ''luciferase assay'' in Matlab and then we interpolated them usic a cubic spline. |
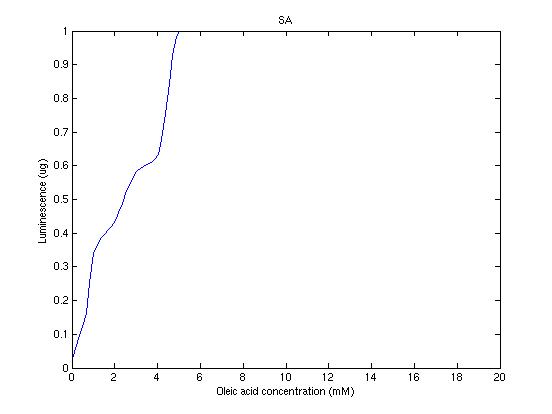
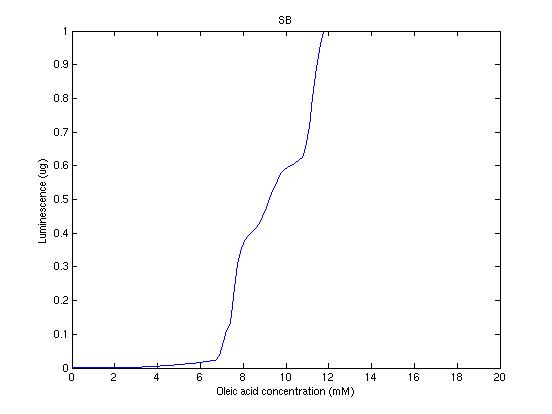
| + | Thanks to this analysis we can ''try'' to use different inputs. So we can get ''the best'' parameters for the system. Using data from ''luciferase assay'' we found two curves that saturates when oleic acid concentration is about 4 mM and 12 mM. This is showed in the following: | ||
[[Image:input1.jpg]] | [[Image:input1.jpg]] | ||
[[Image:input2.jpg]] | [[Image:input2.jpg]] | ||
Revision as of 09:57, 14 September 2007
We imported the data from luciferase assay in Matlab and then we interpolated them usic a cubic spline. Thanks to this analysis we can try to use different inputs. So we can get the best parameters for the system. Using data from luciferase assay we found two curves that saturates when oleic acid concentration is about 4 mM and 12 mM. This is showed in the following:

