Princeton/Template:temp
From 2007.igem.org
(Difference between revisions)
m (Princeton/temp moved to Princeton/Template:temp) |
|||
| Line 1: | Line 1: | ||
__NOEDITSECTION__ | __NOEDITSECTION__ | ||
| + | |||
| + | [[Image:Princeton signature.png|center|image: Princeton University signature]] | ||
| + | |||
| + | <!--[[Image:Princeton projecttitle.png|center|image: A lentivirus-delivered, RNAi-enhanced, logic circuit for cancer-specific detection and destruction]]--> | ||
| + | |||
| + | =Simulation= | ||
| + | |||
| + | A version of the [http://opnsrcbio.molsci.org/stochastirator/ Stochastirator], a stochastic simulation program, modified by [http://weisswebserver.ee.princeton.edu/ Weiss lab], driven by [http://www.mathworks.com/ Mathworks] Matlab is used to model the state of our systems. | ||
| + | |||
| + | The corresponding source, brief tutorial for our internal systems, and recent code snapshot is provided as an [http://weisswebserver.ee.princeton.edu/igem/2007/p/stoch.zip archive], for reference. | ||
| + | |||
| + | The figures corresponding to a [[Princeton/project_overview | basic version]] of our system are given below. | ||
| + | |||
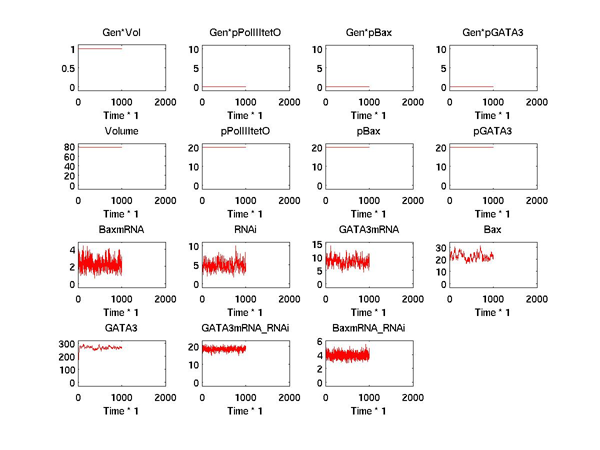
| + | [[Image:Princeton_fig_sim_basic_normal.png|center|frame|Figure 1. image: State variation with time for a normal cell with the basic version of our system.]] | ||
| + | |||
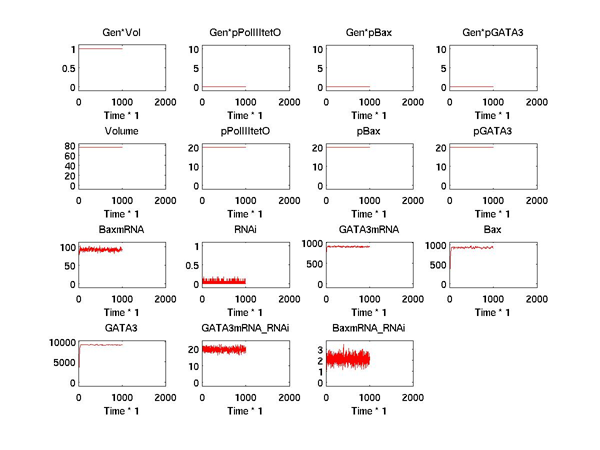
| + | [[Image:Princeton_fig_sim_basic_cancer.png|center|frame|Figure 2. image: State variation with time for a cancerous cell with the basic version of our system. Note difference in vertical scaling.]] | ||
Revision as of 03:14, 25 October 2007
Simulation
A version of the [http://opnsrcbio.molsci.org/stochastirator/ Stochastirator], a stochastic simulation program, modified by [http://weisswebserver.ee.princeton.edu/ Weiss lab], driven by [http://www.mathworks.com/ Mathworks] Matlab is used to model the state of our systems.
The corresponding source, brief tutorial for our internal systems, and recent code snapshot is provided as an [http://weisswebserver.ee.princeton.edu/igem/2007/p/stoch.zip archive], for reference.
The figures corresponding to a basic version of our system are given below.


