Virginia Tech/pre model

From 2007.igem.org

(Difference between revisions)
m
m
Line 72: Line 72:
| style="padding: 20px; background-color: #FFFFFF;" |
| style="padding: 20px; background-color: #FFFFFF;" |
 +
<h3>Our preliminary model was our first attempt at modeling an infection in a single population.</h3>
 +
Once we generated experimental data later in the summer, we revised it significantly. Here is a summary of our original approach using reaction equations, the hybrid simulator, and our toolkit.
 +
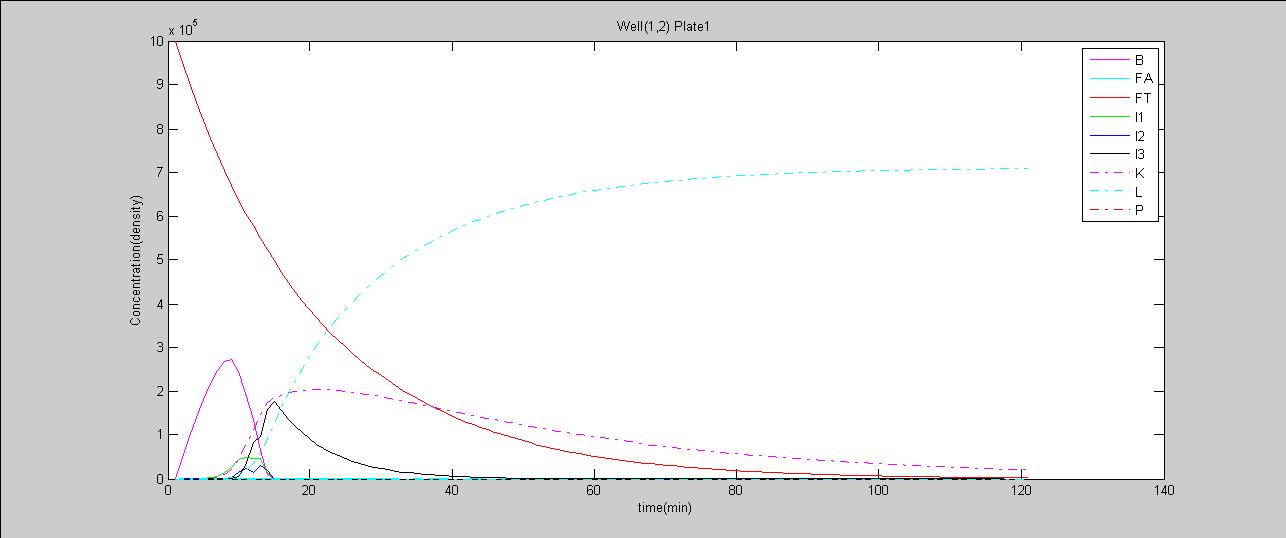
[[Image:Model2_all.jpg|thumb|right|500px|'''A graph generated by the simulator''' zoomed in on all species except phage, which grows on a much larger scale than other species]]
-
<p>'''The Model'''<br>
+
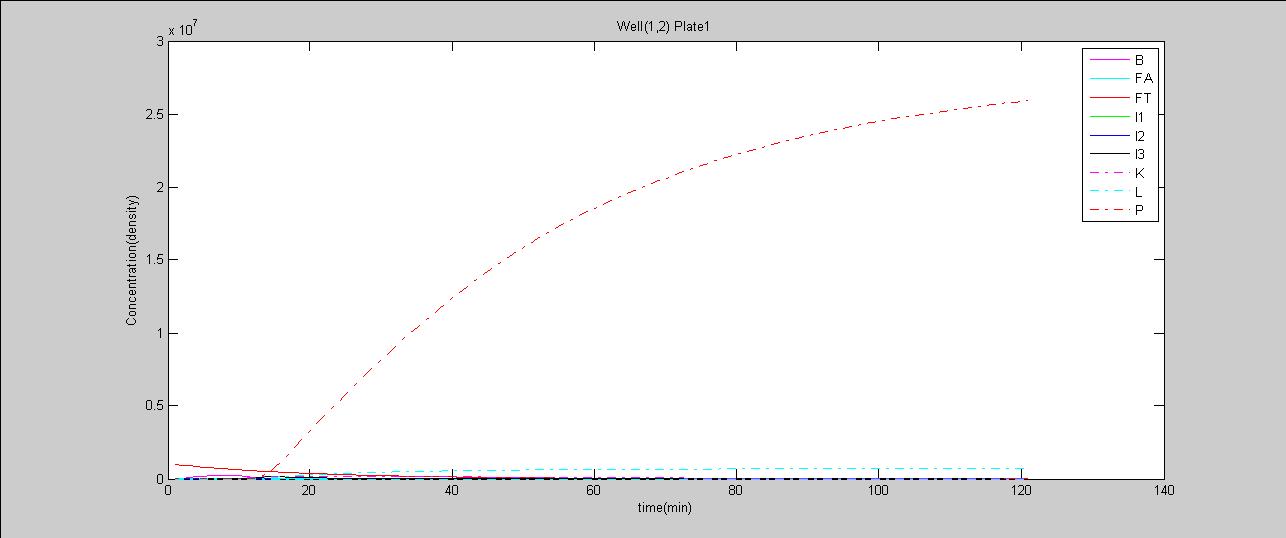
[[Image:Model2_phage.jpg|thumb|right|500px|'''All species in one infection reaction''' As the phage (P) infects the uninfected bacteria (B) the amount of uninfected cells decline and number of lysogenic (L) and lytic (K) cells increase. As the lytic cells burst and release phage into the environment, the number of lytic gradually decline and the number of phage quickly increase.]]
-
''July 12, 2007'' </p>
+
<h3>The Model</h3>
-
<p>Reactions:<br>
+
-
Rxn_1:  B + P --> I1 [200]<br>
+
-
Rxn_2:  I1 + P --> I2 [200]<br>
+
-
Rxn_3:  I2 + P --> I3 [200]<br>
+
-
Rxn_4:  I1 --> L [6.667000e-002]<br>
+
-
Rxn_5:  I1 --> K [6.000000e-001]<br>
+
-
Rxn_6:  I2 --> L [6.667000e-002]<br>
+
-
Rxn_7:  I2 --> K [1.555600e-001]<br>
+
-
Rxn_8:  I3 --> L [6.667000e-002]<br>
+
-
Rxn_9:  I3 --> K [6.667000e-002]<br>
+
-
Rxn_10:  K --> 100P [2.500000e-002]<br>
+
-
Rxn_11:  B + FA --> 2B [5.000000e-002]<br>
+
-
Rxn_12:  L + FA --> 2L [5.000000e-002]<br>
+
-
Rxn_13:  FT --> FA [5.000000e-002]</p>
+
-
<p>InitialValues:<br>
+
'''Reactions:'''
 +
 
 +
'''Rxn_1:'''  B + P --> I1 [200]<br>
 +
'''Rxn_2:'''  I1 + P --> I2 [200]<br>
 +
'''Rxn_3:'''  I2 + P --> I3 [200]<br>
 +
'''Rxn_4:'''  I1 --> L [6.667000e-002]<br>
 +
'''Rxn_5:'''  I1 --> K [6.000000e-001]<br>
 +
'''Rxn_6:'''  I2 --> L [6.667000e-002]<br>
 +
'''Rxn_7:'''  I2 --> K [1.555600e-001]<br>
 +
'''Rxn_8:'''  I3 --> L [6.667000e-002]<br>
 +
'''Rxn_9:'''  I3 --> K [6.667000e-002]<br>
 +
'''Rxn_10:'''  K --> 100P [2.500000e-002]<br>
 +
'''Rxn_11:'''  B + FA --> 2B [5.000000e-002]<br>
 +
'''Rxn_12:'''  L + FA --> 2L [5.000000e-002]<br>
 +
'''Rxn_13:'''  FT --> FA [5.000000e-002]</p>
 +
 
 +
 
 +
'''InitialValues:'''
B=10000<br>
B=10000<br>
P=100<br>
P=100<br>
FT=1.000000e+006</p>
-
<p>B represents uninfected bacteria, P represents phage virus, I is an intermediate stage, K represents lytic, L represents lysogenic, and FT and FA are food.  The first reaction represents a phage virus infecting a bacterial cell.  When the cell becomes infected, it can either turn lytic (a mass of phage viruses are replicated inside the cell and released by bursting the cell) or lysogenic (the phage stays dormant in the cell).  This decision, to choose between lytic and lysogenic, is based on environmental factors surrounding the bacterial cell.  If there is an excess of phage viruses in the environment, the infecting phage has a high probability of becoming lysogenic; however, if there is a scarcity of phage viruses surrounding the bacterial cell, there is a high probability that the phage will become lytic. The intermediate I is used as a reaction to set these probabilities.  The growth of the bacteria and lysogenic cells are limited by available food.  This is done so that the cells don't grow unhindered.</p>
 
-
 
-
<p>'''Observing the Reactions in Action'''<br>
 
-
''July 23, 2007''</p>
 
-
 
-
<p><html><a href="https://static.igem.org/mediawiki/2007/d/d0/Model2_all.jpg"><img src="https://static.igem.org/mediawiki/2007/d/d0/Model2_all.jpg" width="553" height="231"></a></html>
 
-
 
-
<br>Zoomed in on all species except phage, which grows on a much larger scale than other species.</p>
 
-
 
-
<p><html><a href="https://static.igem.org/mediawiki/2007/6/6f/Model2_phage.jpg"><img src="https://static.igem.org/mediawiki/2007/6/6f/Model2_phage.jpg" width="553" height="231"></a></html>
 
-
 
-
<br>All species in one infection reaction.</p>
 
-
<p>As the phage (P) infects the uninfected bacteria (B) the amount of uninfected cells decline and number of lysogenic (L) and lytic (K) cells increase. As the lytic cells burst and release phage into the environment, the number of lytic gradually decline and the number of phage quickly increase.</p>
+
'''The Species:'''
 +
B = uninfected bacteria<br>
 +
P = phage  
 +
I = intermediate stage
 +
K = lytic ''E. coli''
 +
L = lysogenic ''E. coli''
 +
FT and FA = food
 +
'''How the model works'''
 +
The first reaction represents a phage infecting a bacterial cell.  When the cell becomes infected, it can either turn lytic or lysogenic. This decision is based on environmental factors surrounding the bacterial cell.  If there is an excess of phage in the environment, an infected ''E. coli'' has a high probability of becoming lysogenic; however, if there is a scarcity of phage viruses surrounding the bacterial cell, there is a high probability that the cell will become lytic. The intermediate I is used to control the probabilities surrounding this decision.  The growth of the bacteria and lysogenic cells are limited by available food so that the cells don't grow unhindered.
|}<html></center></html>
|}<html></center></html>

Revision as of 01:14, 25 October 2007

Title progress.JPG

Dot1.JPG

Dot1.JPG

Dot1.JPG

Dot1.JPG

Dot1.JPG

The Preliminary Model

Our preliminary model was our first attempt at modeling an infection in a single population.

Once we generated experimental data later in the summer, we revised it significantly. Here is a summary of our original approach using reaction equations, the hybrid simulator, and our toolkit.

A graph generated by the simulator zoomed in on all species except phage, which grows on a much larger scale than other species
All species in one infection reaction As the phage (P) infects the uninfected bacteria (B) the amount of uninfected cells decline and number of lysogenic (L) and lytic (K) cells increase. As the lytic cells burst and release phage into the environment, the number of lytic gradually decline and the number of phage quickly increase.

The Model

Reactions:

Rxn_1: B + P --> I1 [200]
Rxn_2: I1 + P --> I2 [200]
Rxn_3: I2 + P --> I3 [200]
Rxn_4: I1 --> L [6.667000e-002]
Rxn_5: I1 --> K [6.000000e-001]
Rxn_6: I2 --> L [6.667000e-002]
Rxn_7: I2 --> K [1.555600e-001]
Rxn_8: I3 --> L [6.667000e-002]
Rxn_9: I3 --> K [6.667000e-002]
Rxn_10: K --> 100P [2.500000e-002]
Rxn_11: B + FA --> 2B [5.000000e-002]
Rxn_12: L + FA --> 2L [5.000000e-002]
Rxn_13: FT --> FA [5.000000e-002]</p>


InitialValues: B=10000
P=100
FT=1.000000e+006</p>


The Species: B = uninfected bacteria
P = phage I = intermediate stage K = lytic E. coli L = lysogenic E. coli FT and FA = food

How the model works

The first reaction represents a phage infecting a bacterial cell. When the cell becomes infected, it can either turn lytic or lysogenic. This decision is based on environmental factors surrounding the bacterial cell. If there is an excess of phage in the environment, an infected E. coli has a high probability of becoming lysogenic; however, if there is a scarcity of phage viruses surrounding the bacterial cell, there is a high probability that the cell will become lytic. The intermediate I is used to control the probabilities surrounding this decision. The growth of the bacteria and lysogenic cells are limited by available food so that the cells don't grow unhindered.