Click here for the results
From 2007.igem.org
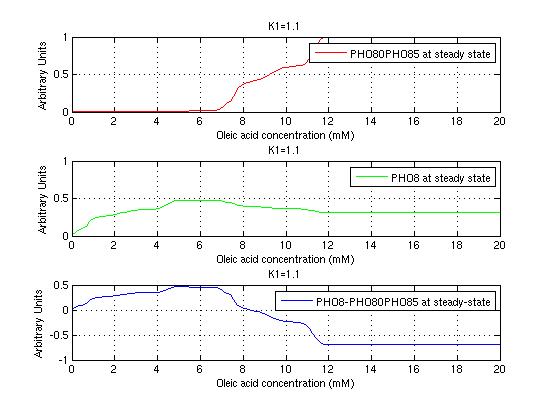
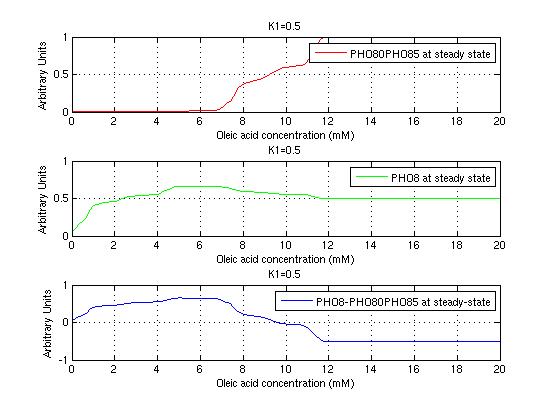
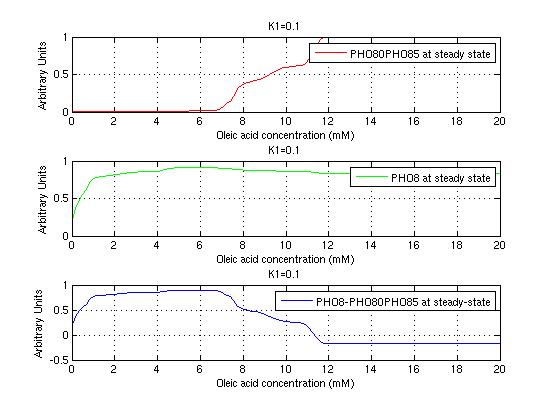
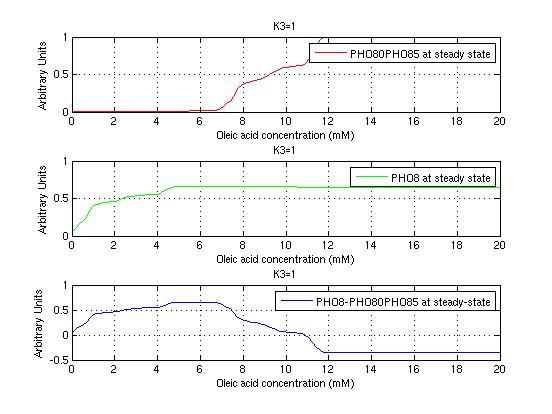
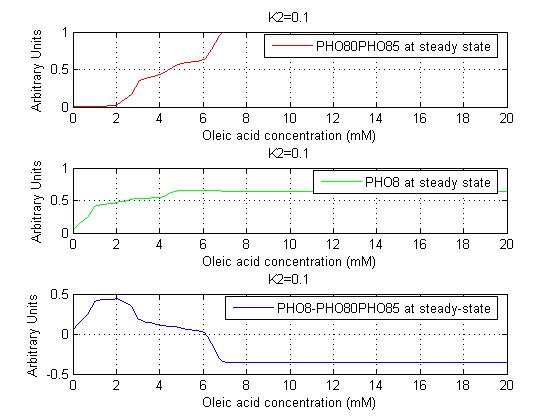
Using Matlab we simulated the behavior of the system when o.a. concentration varies. Then, we plotted the steady state values of PHO80PHO85 (red light) and PHO8 (green light). We started by examining the results using the first couple of input functions, i.e. saturating at 4mM and 12mM. The following pictures show the results of this analysis when K1 varies.
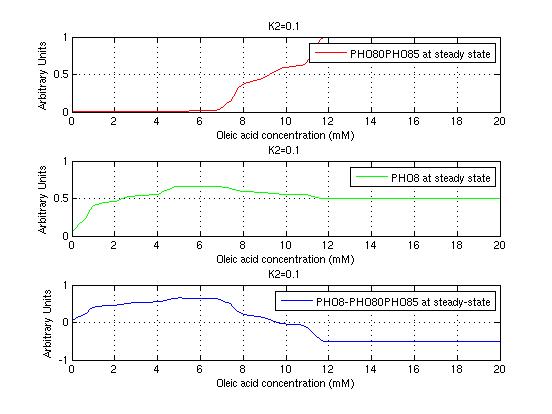
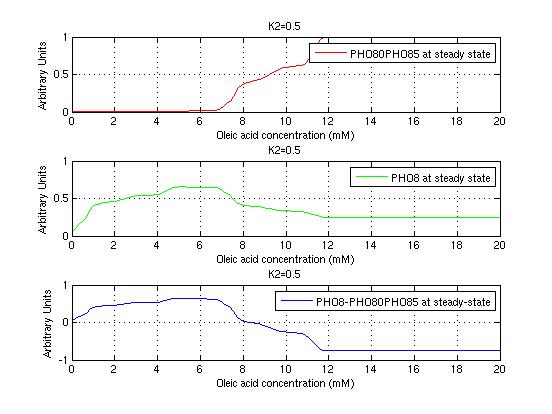
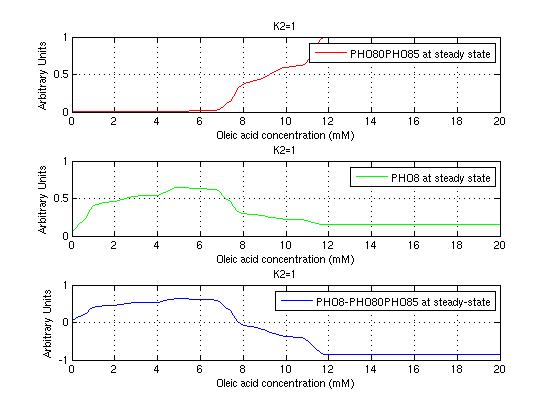
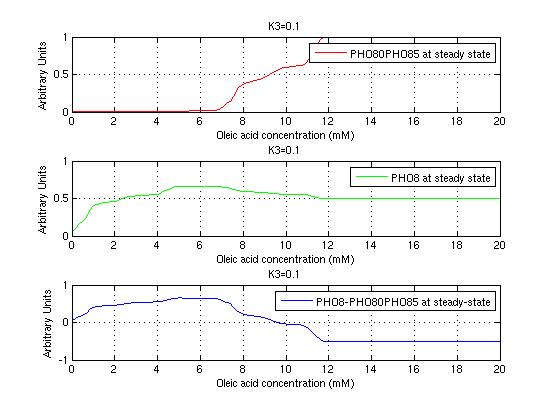
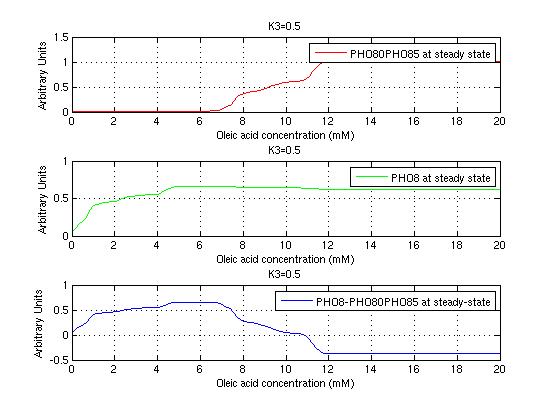
It's clear that k1=0.1 and K1=0.5 doesn't ensure a correct behavior of the system: the repression of PHO8 is too weak when the oleic acid concentration becomes greater than 7.1 mM! We repeated the same analysis for the varying parameters K2 and K3 and we found that a good behavior is given by k2=1 and k3=0.1. This is confirmed be the following pictures:
Using the second couple of input functions, i.e saturating at 4mM and 6mM. Now we can guarantee a green light for extra virgin oil, red light for the not edible oil and a mix of red and green for virgin oil. So, we can now distiguish three levels with three different colours, while in the previous case we had no colours for extra virgin oil. The following pictures show the steady state behavior of the system. Only the good parameters behavior is showed here (K1=0.5, K2=0.1, K3=1):
