Tristable/Modeling
From 2007.igem.org
(→Stability) |
|||
| Line 144: | Line 144: | ||
==Stability== | ==Stability== | ||
| - | |||
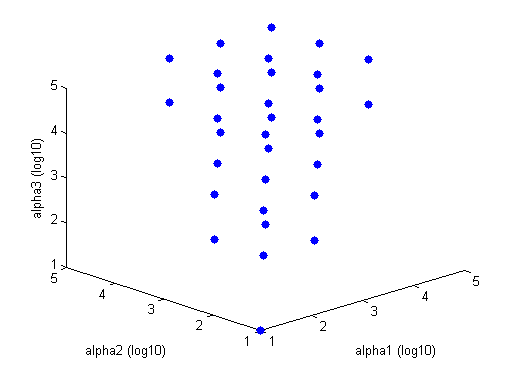
| - | Blue points are stable combinations of repressor production rates, while | + | Blue points are stable combinations of repressor production rates, while the rest of the graph is comprised of unstable combinations of repressor production rates. [[Image:tri stableRegion.png|left|Tri-Stable region solved in Matlab]]This graph is for Beta = 2. The tristable region gets larger (i.e. more disparate alpha values will be able to constitute a tristable system) as beta gets larger. The tristable region disappears when Beta equals one or less. |
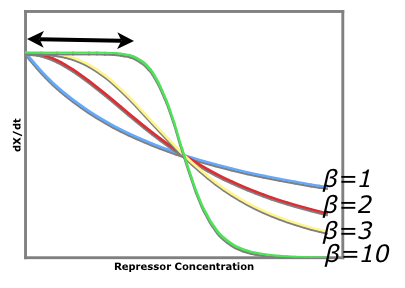
An easy visual aid to seeing how increased beta values (cooperativity of repression) leads to a more stable system consider the following graph of rate of production of repressor1 vs. the repressor that inhibits the production of repressor1. dx/dt vs. [y] | An easy visual aid to seeing how increased beta values (cooperativity of repression) leads to a more stable system consider the following graph of rate of production of repressor1 vs. the repressor that inhibits the production of repressor1. dx/dt vs. [y] | ||
| Line 153: | Line 152: | ||
The black arrow shows that there is a larger region for larger beta values where stray repessors will not significantly affect the rate of repressor production rate whereas in a system of beta = 1, stray repressors will significantly change the system, making it less robust. | The black arrow shows that there is a larger region for larger beta values where stray repessors will not significantly affect the rate of repressor production rate whereas in a system of beta = 1, stray repressors will significantly change the system, making it less robust. | ||
| + | |||
==Modeling== | ==Modeling== | ||
The first draft of the code started last year: | The first draft of the code started last year: | ||
Revision as of 00:13, 25 October 2007

|
||||||||||||||||||


