Edinburgh/DivisionPopper/Modelling
From 2007.igem.org
Luca.Gerosa (Talk | contribs) (→PoPS signal) |
Luca.Gerosa (Talk | contribs) (→CTMC (stochastic and discrete)) |
||
| (107 intermediate revisions not shown) | |||
| Line 1: | Line 1: | ||
'''MENU''' :[[Edinburgh/DivisionPopper| Introduction]] | [[Edinburgh/DivisionPopper/References|Background]] | [[Edinburgh/DivisionPopper/Applications|Applications]] | [[Edinburgh/DivisionPopper/Design|Design&Implementation]] | [[Edinburgh/DivisionPopper/Modelling|Modelling]] | [[Edinburgh/DivisionPopper/Status|Wet Lab]] | [[Edinburgh/DivisionPopper/SBApproach|Synthetic Biology Approach]] | [[Edinburgh/DivisionPopper/Conclusions|Conclusions]] | '''MENU''' :[[Edinburgh/DivisionPopper| Introduction]] | [[Edinburgh/DivisionPopper/References|Background]] | [[Edinburgh/DivisionPopper/Applications|Applications]] | [[Edinburgh/DivisionPopper/Design|Design&Implementation]] | [[Edinburgh/DivisionPopper/Modelling|Modelling]] | [[Edinburgh/DivisionPopper/Status|Wet Lab]] | [[Edinburgh/DivisionPopper/SBApproach|Synthetic Biology Approach]] | [[Edinburgh/DivisionPopper/Conclusions|Conclusions]] | ||
| - | This | + | This page contains the mathematical and computational models we constructed in order to analyze the behaviour of the Division PoPper system. You can find the models of three constructs (the proof of concept, the Division PoPper, the composition of the Division PoPper with a counter device), using different approaches to modelling (with Ordinary Differential Equations and with Gillespie simulation on a CTMC). Look at the table of contents below for the section you are interested in. |
__TOC__ | __TOC__ | ||
| Line 10: | Line 10: | ||
| - | * ''Is the system working well with standard E. | + | * ''Is the system working well with standard ''E. coli'' division time?'' |
* ''Is the system working well with normal YFP, GFP Expression and degradation rate?'' | * ''Is the system working well with normal YFP, GFP Expression and degradation rate?'' | ||
* ''How can we tune these parameters in order to have meaningful tests from the construct in the lab?'' | * ''How can we tune these parameters in order to have meaningful tests from the construct in the lab?'' | ||
| - | Since the mechanisms and the values that characterize the system are sometimes not known or time consuming/difficult to discovery in the lab, we use the models as "in silico" | + | Since the mechanisms and the values that characterize the system are sometimes not known or time consuming/difficult to discovery in the lab, we use the models as "in silico" tests. Thus our models should be dependent on (functions of) the following quantities: |
| Line 24: | Line 24: | ||
| - | In order to construct the proper model, we need to identify | + | In order to construct the proper model, we need to identify the dynamics of the system. Since the real biological mechanisms are too complex, several approximations and abstractions are introduced at this step. In this sense, we can simplify the dynamics of the system by observing that our construct can be in one of three states during the time evolution: ''Forward'', ''Flipping'' and ''Backward'' phase. These three phases happen in an order controlled by cell division. In detail: |
{| border="1" cellpadding="20" cellspacing="0" | {| border="1" cellpadding="20" cellspacing="0" | ||
| Line 31: | Line 31: | ||
|- | |- | ||
|[[Image:proof2forward.png|400px]] | |[[Image:proof2forward.png|400px]] | ||
| - | |The system starts in this phase. It is the phase in which the promoter is oriented in the 5' to 3' direction, thus controlling the expression of YFP coding region. In this phase in the cell there is expression of YFP and no expression of GFP. | + | |The system starts in this phase. It is the phase in which the promoter is oriented in the 5' to 3' direction, thus controlling the expression of the YFP coding region. In this phase in the cell there is expression of YFP and no expression of GFP. |
|- | |- | ||
|[[Image:proof2flipping.png|400px]] | |[[Image:proof2flipping.png|400px]] | ||
| - | |The system is in this phase when the recombinase activity has been initialized and not yet concluded. In this phase in the cell we assume there is no expression of YFP and no expression of GFP because the two coding regions are not | + | |The system is in this phase when the recombinase activity has been initialized and not yet concluded. In this phase in the cell we assume there is no expression of YFP and no expression of GFP because the two coding regions are not controlled by the promoter regulatory effect. |
|- | |- | ||
|[[Image:proof2backward.png|400px]] | |[[Image:proof2backward.png|400px]] | ||
| - | | | + | |This is the phase in which the promoter is oriented in the 3' to 5' direction, thus controlling the expression of the GFP coding region. In this phase in the cell there is expression of GFP and no expression of YFP. |
|- | |- | ||
|} | |} | ||
| - | + | These are the three states (phases) in which the proof of concept system can be during its time course evolution. The system passes through these phases according to cell division timing and following the pattern: ''forward phase'', ''flipping phase'', ''backward phase'', ''flipping phase'' and so on. | |
A picture clarifies better the time course behaviour: | A picture clarifies better the time course behaviour: | ||
| Line 50: | Line 50: | ||
=== Modelling a single cell === | === Modelling a single cell === | ||
| - | As first step, we are interested in investigating the behaviour of the system at the level of a single cell. In particular, we are interested in following the | + | As first step, we are interested in investigating the behaviour of the system at the level of a single cell. In particular, we are interested in following the time course of behaviour of one single cell line. This means that in our model we start observing a individual cell behaviour and at each cell division we follow one of the two daughter cells and so on. We make the assumption of only one plasmid present in each cell. |
| - | For that we construct two different approaches: using Ordinary Differential | + | For that we construct two different approaches: using Ordinary Differential Equations and Stochastic Process Algebra. The first is deterministic (the behaviour of the system is defined only by the values of the variables) and treats the population of molecules as a continuous value. It gives us a general understanding of the "average" behaviour of the time evolution of a cell. The second is stochastic (the behaviour of the system is defined by the value of normal and random variables) and treats the population of molecules as a discrete value. It gives us (theoretically) a better understanding of the different trajectories in the behaviour of individual cells and can help in the future for simulating the behaviour of a population. |
====ODEs (deterministic and continuous)==== | ====ODEs (deterministic and continuous)==== | ||
| - | We define a set of ordinary differential equations that represents the behaviour of a individual cell during time. | + | We define a set of ordinary differential equations that represents the behaviour of a individual cell during time. First, we define a set of equations for each one of the three phases (''Forward'', ''Flipping'', ''Backward'') and then we construct a unified set of equations by using two support functions. The concentrations in which we are interested are obviously GFP and YFP concentrations. |
The biological mechanisms (or processes) we need to represent are: gene expression of proteins and degradation of proteins. | The biological mechanisms (or processes) we need to represent are: gene expression of proteins and degradation of proteins. | ||
We assume gene expression of a protein to be in on or off state and, when in the on state, to be expressed at a constant rate. | We assume gene expression of a protein to be in on or off state and, when in the on state, to be expressed at a constant rate. | ||
| Line 75: | Line 75: | ||
|Forward Phase: | |Forward Phase: | ||
| - | [[Image:proofforwardprocesses.png| | + | [[Image:proofforwardprocesses.png|500px]] |
|d[YFP]/dt = ''YFPexp'' - ''YFPdeg''*[YFP] | |d[YFP]/dt = ''YFPexp'' - ''YFPdeg''*[YFP] | ||
| Line 82: | Line 82: | ||
|Flipping Phase: | |Flipping Phase: | ||
| - | [[Image:proofflippingprocesses.png| | + | [[Image:proofflippingprocesses.png|500px]] |
|d[YFP]/dt = - ''YFPdeg''*[YFP] | |d[YFP]/dt = - ''YFPdeg''*[YFP] | ||
| Line 89: | Line 89: | ||
|Backward Phase: | |Backward Phase: | ||
| - | [[Image:proofbackwardprocesses.png| | + | [[Image:proofbackwardprocesses.png|500px]] |
|d[YFP]/dt = - ''YFPdeg''*[YFP] | |d[YFP]/dt = - ''YFPdeg''*[YFP] | ||
| Line 111: | Line 111: | ||
!Data | !Data | ||
!Values | !Values | ||
| - | |||
|- | |- | ||
|YFP expression rate | |YFP expression rate | ||
| - | | | + | |0.0001 |
| - | + | ||
|- | |- | ||
|GFP expression rate | |GFP expression rate | ||
| - | | | + | |0.0001 |
| - | + | ||
|- | |- | ||
|YFP degradation | |YFP degradation | ||
| - | | | + | |0.05 (fast because of LVA tag) |
| - | + | ||
|- | |- | ||
|GFP degradation | |GFP degradation | ||
| - | | | + | |0.05 (fast because of LVA tag) |
| - | + | ||
|- | |- | ||
|Flipping duration | |Flipping duration | ||
| - | | | + | |5 minutes (estimated) |
| - | + | ||
|- | |- | ||
| - | | | + | |Division duration |
| - | | | + | |80 minutes (slowed division rate) |
| - | + | ||
|} | |} | ||
We implemented this model using the [http://www.sbtoolbox.org/ Systems Biology Toolbox for MATLAB] and the related code can be downloaded [[Edinburgh/SBCode | here]]. | We implemented this model using the [http://www.sbtoolbox.org/ Systems Biology Toolbox for MATLAB] and the related code can be downloaded [[Edinburgh/SBCode | here]]. | ||
| + | With the parameter stated above we simulated the system obtaining this graph: | ||
| - | + | [[Image:ProofOfConcept1.jpg]] | |
| + | |||
| + | After having run a sensitivity analysis on the most influencing parameters we realized that our system is strongly dependent on the fast degradation of GFP and YFP. By putting a slower values of YFP and GFP degradation (0.005) we obtain this graph: | ||
| + | |||
| + | [[Image:ProofOfConcept2.jpg]] | ||
====CTMC (stochastic and discrete)==== | ====CTMC (stochastic and discrete)==== | ||
| - | Obviously the behaviour simulated by the ODEs system accounts as an "average" behaviour: we do not expect all cells to be exactly in the same state during time. Moreover we know that physically populations are not continues values but change in a discrete way. In order to deal with the implicit stochasticity and diversity of biological system, in the last years stochastic approaches have been investigated. In our case we use an approach based on [http://en.wikipedia.org/wiki/Process_calculi Process Algebras] (as formalism to define the system) and [http://en.wikipedia.org/wiki/CTMC | + | Obviously the behaviour simulated by the ODEs system accounts as an "average" behaviour: we do not expect all cells to be exactly in the same state during time. Moreover we know that physically populations are not continues values but change in a discrete way. In order to deal with the implicit stochasticity and diversity of biological system, in the last years stochastic approaches have been investigated. In our case we use an approach based on [http://en.wikipedia.org/wiki/Process_calculi Process Algebras] (as formalism to define the system) and [http://en.wikipedia.org/wiki/CTMC Continuous Time Markov Chain (CTMC)] (as mathematical model). The Process Algebra we use to define the system is [http://www.dcs.ed.ac.uk/pepa/ PEPA], developed in Edinburgh University. For each species, we define a set of PEPA processes, each one representing a possible population level. Then we add some stochastic actions representing the event of expressing a protein or degrading a protein. |
The PEPA definitions are: | The PEPA definitions are: | ||
| - | YFP(I)= (YFPexp,rYFPexp).YFP(I+1) + (YFPdeg,rYFPdeg).YFP(I-1) | + | YFP(I)= (YFPexp,rYFPexp).YFP(I+1) + (YFPdeg,rYFPdeg).YFP(I-1) |
| + | ''for 0<I<maxYFP, where maxYFP is the maximal number of molecules of YFP'' | ||
| + | |||
| + | GFP(I)= (GFPexp,rGFPexp).GFP(I+1) + (GFPdeg,rGFPdeg).GFP(I-1) | ||
| + | ''for 0<J<maxGFP, where maxGFP is the maximal number of molecules of GFP'' | ||
| - | + | FORWARDPHASE= (YFPexp,rYFPexp).FORWARDPHASE + (ChangePhaseToFlipping,rChangePhaseToFlipping).FLIPPINGPHASE1 | |
| + | FLIPPINGPHASE1= (ChangePhaseToBacward,rChangePhaseToBacward).BACKWARDPHASE | ||
| + | FLIPPINGPHASE2= (ChangePhaseToForward,rChangePhaseToForward).FORDWARDPHASE | ||
| + | BACKWARDPHASE= (GFPexp,rGFPexp).BACKWARDPHASE + (ChangePhaseToFlipping,rChangePhaseToFlipping).FLIPPINGPHASE2 | ||
| - | + | The exponential rates are have been derived from the ODEs related parameter or reasoned. | |
| - | + | ||
| - | + | ||
| - | + | ||
| - | + | ||
| - | + | ||
| - | + | ||
| - | + | ||
| - | + | ||
| - | + | ||
| - | + | ||
| - | + | ||
| - | The exponential rates are | + | |
| - | + | ||
| - | + | ||
| - | + | ||
| - | + | ||
| - | + | ||
| - | + | ||
| - | + | ||
| - | + | ||
| - | + | ||
| - | + | ||
| - | + | ||
| - | + | ||
| - | + | ||
| - | + | ||
| - | + | ||
| - | + | ||
| - | + | ||
| - | + | ||
| - | + | ||
| - | + | ||
| - | + | ||
| - | + | ||
| - | + | ||
| - | + | ||
| - | + | ||
| - | + | ||
| - | + | ||
| - | + | ||
| - | + | ||
| - | + | ||
| - | + | ||
| - | + | ||
| - | + | ||
| - | + | ||
| - | The system initial configuration is | + | The system initial configuration is: |
YFP(initYFP)<YFPexp>FORWARDPHASE<GFPexp>GFP(initGFP) | YFP(initYFP)<YFPexp>FORWARDPHASE<GFPexp>GFP(initGFP) | ||
| Line 206: | Line 165: | ||
where initYFP is the initial number of YFP molecules and initiGFP is the initial number of GFP molecules | where initYFP is the initial number of YFP molecules and initiGFP is the initial number of GFP molecules | ||
| - | Using CTMC we are forced to use a stochastic event also for division time. We assume the division time and the flipping time to be | + | Using CTMC we are forced to use a stochastic event also for division time. We assume the division time and the flipping time to be exponentially distributed. From the initial configuration is possible then to derive the underlying CTMC of the model. Because of the simplicity of the system, we have implemented it directly in [http://www.prismmodelchecker.org/ PRISM] (the code can be downloaded [[/Edinburgh/PRISMCode | here]]) and then simulated the CTMC (using the [http://en.wikipedia.org/wiki/Gillespie_algorithm Gillespie Algorithm]). A single simulation looks like: |
| - | + | [[Image:ProofStochastic.jpg|600px]] | |
| - | + | in detail when switching from one phase to the other. | |
| - | + | [[Image:ProofStochastic2.jpg|800px]] | |
| - | + | on a longer run that consider more than one division. | |
| - | + | NB: This approach can be used to model more complex systems (pathways and gene networks for examples). A graphical notation used as human interface to process algebra, the theoretical background, guidelines and case studies of this approach are the Master Dissertation topic of one of the team member ([https://2007.igem.org/User:Luca.Gerosa Luca Gerosa]). [https://static.igem.org/mediawiki/2007/0/0d/DissertationLucaGerosa.pdf The Dissertation PDF can be viewed or downloaded from here]. | |
| - | + | ====Results==== | |
| - | + | The ODEs and the stochastic models, not surprisingly, show the same kind of behaviour regarding to the expression and degradation processes. By running sensitivity analysis and comparing simulation runs with different parameter values, it is possible to observe that the most important factor for the functioning of the Proof of Concept construct is the degradation rate of the two fluoresent proteins. This has to be made as fast as possible, for example by addition of rapid-degradation protein tails. The result of a slow protein degradation rate is the continuously high presence of fluoresence for both colours, leading to an inability to observe flipping behaviours. | |
| - | + | Regarding the cell division duration, the simulation with a duration between 40-80 minutes and a flipping phase of 0-20 minutes has showed to not be influencing adversely the device behaviour. | |
| + | The stochastic simulation permitted the analysis of the behaviour in the case of highly random division frequency in the colony. Although the exponential random distribution seems quite unrealistic for this kind of parameter, it is still interesting to consider that the functions of the test construct don't seem to be altered except in the case of very rapid division. | ||
== The Division PoPper device == | == The Division PoPper device == | ||
| Line 232: | Line 192: | ||
!Data | !Data | ||
!Values | !Values | ||
| - | |||
|- | |- | ||
| TetR repressor expression rate | | TetR repressor expression rate | ||
| - | | | + | | 0.0001 |
| - | + | ||
|- | |- | ||
| CI lambda repressor expression rate | | CI lambda repressor expression rate | ||
| - | | | + | | 0.0001 |
| - | + | ||
|- | |- | ||
| - | | TetR repressor | + | | TetR repressor degradation rate |
| - | | | + | | 0.05 |
| - | | | + | |- |
| + | | CI lambda repressor degradation rate | ||
| + | | 0.05 | ||
|- | |- | ||
| - | |||
| - | |||
| - | |||
|} | |} | ||
| Line 255: | Line 211: | ||
====ODEs (deterministic and continuous)==== | ====ODEs (deterministic and continuous)==== | ||
| - | The Division PoPper deterministic model has been constructed | + | The Division PoPper deterministic model has been constructed for representing two connected but different quantities. The first simulates the behaviour of the device when a reporter protein coding region is placed downstream. This is a classical situation when we try to properly measure the PoPS signal and so is interesting to predict. |
| - | The second is a model in which we | + | The second is a model in which we properly represent the pure PoPS signal. The way to model a PoPS behaviour is not a classic of modelling literature, so we add fun in understanding which are the best assumptions and equations to use. |
==== PoPS signal ==== | ==== PoPS signal ==== | ||
| - | We need to represent two | + | We need to represent two concentrations that change during time: TetR and CLambdaR. We are also interested in predicting the behaviour of the PoPS signal downstream of the device. While TetR and CLambdaR concentrations are modelled by using ODEs equations, the PoPS signal is modelled as a direct function of repressor concentration during time. We observe that the PoPS signal downstream the Division PoPper is exactly equivalent to the expression rate of a downstream coding region. So the PoPS signal is equivalent to the value of the sigmoidal value we would use to eventually model a protein concentration replenish. This because the behaviour of PoPS can be thought as a sort of step function, in which the PoPS signal is low for a high level of repressor concentration and it increases fast after a "switch point". |
| + | For this reason we modeled the PoPS signal as a sigmoidal function of the repressor concentration in the cell. The function has been adjusted in order to fit with the values of concentration. | ||
| + | |||
| + | We adjust the sigmoidal function by reversing it on the vertical axis, shifting it to the Switch Point (SP) and by multiplying it for the maximal PoPs value PoPSmax. | ||
| + | |||
| + | ==== With reporter protein ==== | ||
| + | |||
| + | For both repressing systems (Tet and Clamba) we used the PoPS signal simulation for controling the velocity of expression of the repressors concentration in the cell. In order to present the equations we assume that YFP protein coding region has been placed downstream Tet and CLambda promoter. | ||
| + | |||
| + | |||
| + | These are the equations for each phase both for PoPS and with reporting protein quantities: | ||
{| border="1" cellpadding="20" cellspacing="0" | {| border="1" cellpadding="20" cellspacing="0" | ||
| Line 268: | Line 234: | ||
|Forward Phase: | |Forward Phase: | ||
| - | [[Image:PoPperforwardprocesses.png| | + | [[Image:PoPperforwardprocesses.png|450px]] |
| - | | | + | |d[TetR]/dt = TetRexp - TetRdeg * [TetR] |
| + | |||
| + | d[CLambdaR]/dt = - CLambdaRdeg * [CLambdaR] | ||
| + | |||
| + | [PoPS]= (1-(1/(1+e^(-[TetR+SP]))) * PoPSmax | ||
| + | |||
| + | d[YFP]/dt = [PoPS] - YFPdeg * [YFP] | ||
|- | |- | ||
|Flipping Phase: | |Flipping Phase: | ||
| - | [[Image:PoPperflippingprocesses.png| | + | [[Image:PoPperflippingprocesses.png|450px]] |
| - | | | + | |d[TetR]/dt = - TetRdeg * [TetR] |
| + | |||
| + | d[CLambdaR]/dt = - CLambdaRdeg * [CLambda] | ||
| + | |||
| + | [PoPS]= 0 | ||
| + | |||
| + | d[YFP]/dt = - YFPdeg * [YFP] | ||
|- | |- | ||
|Backward Phase: | |Backward Phase: | ||
| - | [[Image:PoPperbackwardprocesses.png| | + | [[Image:PoPperbackwardprocesses.png|450px]] |
| - | | | + | |d[TetR]/dt = - TetRdeg * [TetR] |
| - | + | ||
| - | + | ||
| - | = | + | d[CLambdaR]/dt = CLambdaRexp - CLambdaRdeg * [CLambdaR] |
| - | + | [PoPS]= (1-(1/(1+e^(-[CLambdaR+SP]))) * PoPSmax | |
| - | + | ||
| - | + | d[YFP]/dt = [PoPS] - YFPdeg * [YFP] | |
| - | + | ||
| - | + | ||
| - | + | ||
| - | + | ||
| - | + | ||
| - | + | ||
| - | + | ||
| - | + | ||
| - | + | ||
| - | + | ||
| - | + | ||
| - | + | ||
|- | |- | ||
|} | |} | ||
| - | |||
| - | + | We generated a simulation graph for this set of equations and we divided it in two: the Repressor concentratrion behaviour and the output behaviours. | |
| + | [[Image:DivPoPperTotal.JPG|450px]] | ||
| + | |||
| + | The SBToolBox code for the DivisionPoPper model can be found [[Edinburgh/SBCodePoPper | here]]. | ||
====Results==== | ====Results==== | ||
| + | |||
| + | The Division PoPper model has been useful to simulate the supposed behaviour of the final construct. We assumed fast degradation rates for the two repressor proteins and a really strong response of the promoters to changes in repressor concentration. This model can be seen as an hypothetical (and regarding some aspects ideal) behaviour under very favorable conditions and functioning of our biological components. Due to lack of published data and uncertaintly in lab values, we are not yet able to confirm the feasibility in terms of time-scale. It seems quite reasonable anyway to be able to adjust them by lengthening in the laboratory the bacterial division duration, for example by using a minimal growth medium or reduced temperature. | ||
== The division counter system == | == The division counter system == | ||
| - | + | ||
| + | As explained in the [[Edinburgh/DivisionPopper/Applications|Applications]] section, one possible utilisation of the Division PoPper is in counting the number of divisions a cell has undertaken. In order to investigate this possibility on a quantitive base, we tried to combine our ODEs model of the Division PoPper construct to the ([https://2006.igem.org/wiki/index.php/ETH_Zurich_2005#Abstract ETH Zurich Counter]) made for iGEM 2005. | ||
| + | ETH Zurich made a really nice mathematical model and published the MATLAB code ([https://2006.igem.org/wiki/index.php/Mathematical_Modeling Modelling details here] ), offering also an interface for external inputs to their device. | ||
| + | |||
====ODEs (deterministic and continuous)==== | ====ODEs (deterministic and continuous)==== | ||
| + | |||
| + | ([https://2006.igem.org/wiki/index.php/ETH_Zurich_2005#Abstract ETH device]) implements a quite complex biological mechanisim in order to count how many peaks the PoPS input signal has. We replicated the PoPS output signal of Division PoPper in a MATLAB format and we passed it as input file for the Counter MATLAB program made by ETH Zurich | ||
| + | (we made some changes to Zurich code in order to allow full compatibility). In the input file we had to amplify a bit the PoPS signal.. In modelling this is not a problem. In reality this can probably be done by one of the device that will be competing this year (an amplifier, if we are not wrong).. We do love compositionality, because solves problems for you before you encounter them! :P. | ||
| + | |||
| + | What follow is the prediction made by ETH Zurich model code on our PoPS output signal (input for the Counter). | ||
| + | |||
| + | [[Image:PoPperAndCounter.jpg]] | ||
| + | |||
====Results==== | ====Results==== | ||
| + | |||
| + | Looking at the modelled behaviour of the device composed by the Division PoPper and the Counter is possible to see that compatibility is theoretical possible from a qualitative and quantitative point of view. The PoPS signal generate from the Division PopPer, through biological mechanism implemented into the ETH Counter device, is able to cause the rise of R2 at each first peak (thus counting to one) and to rise of R4 at each second following peak (thus counting to two). To confirm that the Counter is working on the PoPS signal, it is possible to see how: | ||
| + | |||
| + | * R1 senses (by going high) the first pulse front | ||
| + | * R2 senses (by going high) the descending front | ||
| + | * R3 senses (by going high) the next pulse front. | ||
| + | * R4 senses (by going high) the next descending front and so on. | ||
| + | |||
| + | ==References== | ||
| + | |||
| + | 1. Attila et al. Contributions of low molecule number and chromosomal positioning | ||
| + | to Stochastic gene expression. Nature genetics, vol 37, number 9 Sep 2005. | ||
| + | |||
| + | 2. Becskei, A., Boselli, M. G. & van Oudenaarden, A. Amplitude control of cell-cycle | ||
| + | waves by nuclear import. Nat Cell Biol 6, 451-7 (2004). | ||
| + | |||
| + | 3. Chu et al. Orientational control is an efficient control mechanism for phase | ||
| + | switching in the E.coli fim system. Journal of Theoretical Biology 244(2007) 541- | ||
| + | 551. | ||
| + | |||
| + | 4. David Braun et al. Parameter estimation for two synthetic gene networks: A case | ||
| + | study. IEEE 2005. | ||
Latest revision as of 17:27, 17 December 2007
MENU : Introduction | Background | Applications | Design&Implementation | Modelling | Wet Lab | Synthetic Biology Approach | Conclusions
This page contains the mathematical and computational models we constructed in order to analyze the behaviour of the Division PoPper system. You can find the models of three constructs (the proof of concept, the Division PoPper, the composition of the Division PoPper with a counter device), using different approaches to modelling (with Ordinary Differential Equations and with Gillespie simulation on a CTMC). Look at the table of contents below for the section you are interested in.
Contents |
The proof of concept system
As explained in the design section, the first part of our project consists in the realization of a proof of concept system. This is a smaller and less complex construct that we use to test our main assumption: the DNA region in between the two Dif sites is "flipped" (reversed) at each cell division. The model should help us in answering the following questions:
- Is the system working well with standard E. coli division time?
- Is the system working well with normal YFP, GFP Expression and degradation rate?
- How can we tune these parameters in order to have meaningful tests from the construct in the lab?
Since the mechanisms and the values that characterize the system are sometimes not known or time consuming/difficult to discovery in the lab, we use the models as "in silico" tests. Thus our models should be dependent on (functions of) the following quantities:
- Cell division frequency (units: minutes): is the time elapsed from one division to the next one.
- Flipping duration (units: minutes): is the time elapsed from starting the flipping to the complete execution.
- YFP/GFP Expression rate (units: protein per second): the rate at which fluorescent proteins are expressed.
- YFP/GFP Degradation rate (units: protein per second): the rate at which fluorescent proteins degrade.
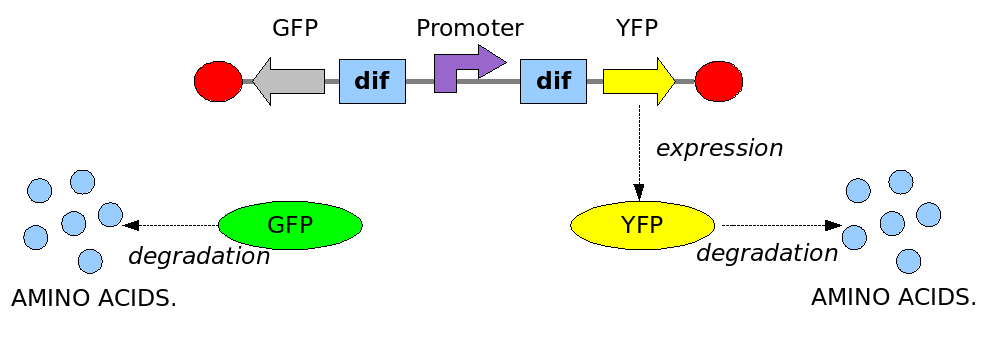
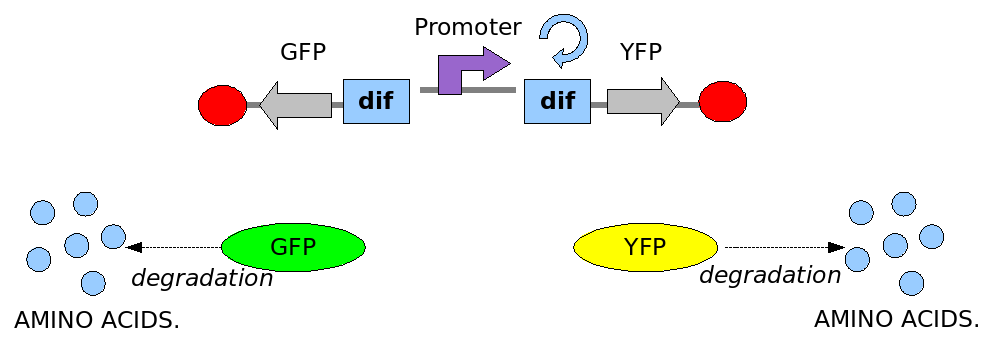
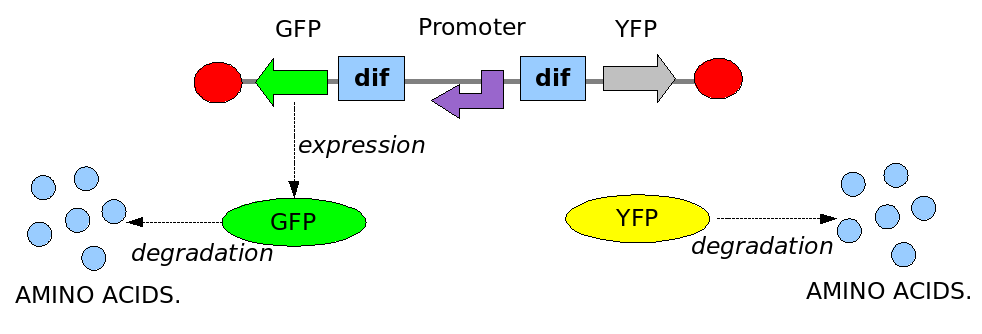
In order to construct the proper model, we need to identify the dynamics of the system. Since the real biological mechanisms are too complex, several approximations and abstractions are introduced at this step. In this sense, we can simplify the dynamics of the system by observing that our construct can be in one of three states during the time evolution: Forward, Flipping and Backward phase. These three phases happen in an order controlled by cell division. In detail:
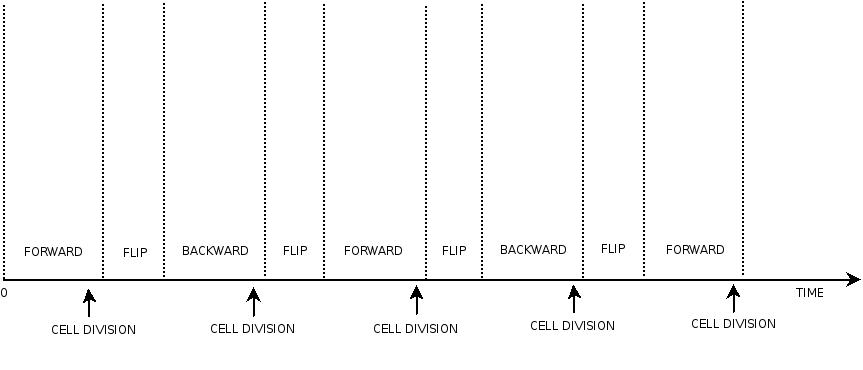
These are the three states (phases) in which the proof of concept system can be during its time course evolution. The system passes through these phases according to cell division timing and following the pattern: forward phase, flipping phase, backward phase, flipping phase and so on. A picture clarifies better the time course behaviour:
The arrows mark the points in time in which a cell division starts.
Modelling a single cell
As first step, we are interested in investigating the behaviour of the system at the level of a single cell. In particular, we are interested in following the time course of behaviour of one single cell line. This means that in our model we start observing a individual cell behaviour and at each cell division we follow one of the two daughter cells and so on. We make the assumption of only one plasmid present in each cell.
For that we construct two different approaches: using Ordinary Differential Equations and Stochastic Process Algebra. The first is deterministic (the behaviour of the system is defined only by the values of the variables) and treats the population of molecules as a continuous value. It gives us a general understanding of the "average" behaviour of the time evolution of a cell. The second is stochastic (the behaviour of the system is defined by the value of normal and random variables) and treats the population of molecules as a discrete value. It gives us (theoretically) a better understanding of the different trajectories in the behaviour of individual cells and can help in the future for simulating the behaviour of a population.
ODEs (deterministic and continuous)
We define a set of ordinary differential equations that represents the behaviour of a individual cell during time. First, we define a set of equations for each one of the three phases (Forward, Flipping, Backward) and then we construct a unified set of equations by using two support functions. The concentrations in which we are interested are obviously GFP and YFP concentrations. The biological mechanisms (or processes) we need to represent are: gene expression of proteins and degradation of proteins. We assume gene expression of a protein to be in on or off state and, when in the on state, to be expressed at a constant rate. We assume degradation of a protein to be rate dependent on the amount of protein present. Thus the variables are:
- YFP expression rate (mol/sec) called YFPexp
- GFP expression rate (mol/sec) called GFPexp
- YFP degradation rate (1/sec) called YFPdeg
- GFP degradation rate (1/sec) called GFPdeg
For each phase the set of equations are:
| Phase | Equations |
|---|---|
| Forward Phase: | d[YFP]/dt = YFPexp - YFPdeg*[YFP]
d[GFP]/dt = - GFPdeg*[GFP] |
| Flipping Phase: | d[YFP]/dt = - YFPdeg*[YFP]
d[GFP]/dt = - GFPdeg*[GFP] |
| Backward Phase: | d[YFP]/dt = - YFPdeg*[YFP]
d[GFP]/dt = GFPexp - GFPdeg*[GFP] |
In order to construct a model that represents the sequence of phases we introduce two support functions called respectively ForwardPhase(t) and BackwardPhase(t). They are time depending: ForwardPhase(t) returns value 1 when the system is in the Forward phase and 0 elsewhere, BackwardPhase(t) returns value 1 when the system is in the Backward Phase and 0 elsewhere.
Then the whole system is defined by equations:
d[YFP]/dt = YFPexp*ForwardPhase(t) - YFPdeg*[YFP]
d[GFP]/dt = GFPexp*BackwardPhase(t) - GFPdeg*[GFP]
The data for the expression and degradation rates and the have been taken from peer-reviewed publications as reference values and summarized in the table below:
| Data | Values |
|---|---|
| YFP expression rate | 0.0001 |
| GFP expression rate | 0.0001 |
| YFP degradation | 0.05 (fast because of LVA tag) |
| GFP degradation | 0.05 (fast because of LVA tag) |
| Flipping duration | 5 minutes (estimated) |
| Division duration | 80 minutes (slowed division rate) |
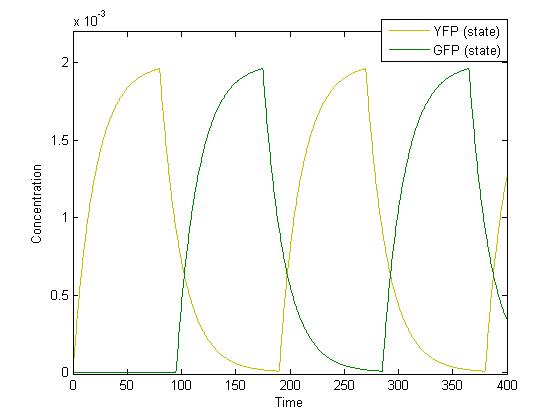
We implemented this model using the [http://www.sbtoolbox.org/ Systems Biology Toolbox for MATLAB] and the related code can be downloaded here.
With the parameter stated above we simulated the system obtaining this graph:
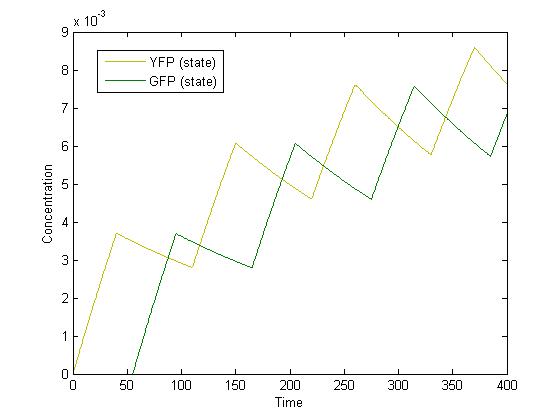
After having run a sensitivity analysis on the most influencing parameters we realized that our system is strongly dependent on the fast degradation of GFP and YFP. By putting a slower values of YFP and GFP degradation (0.005) we obtain this graph:
CTMC (stochastic and discrete)
Obviously the behaviour simulated by the ODEs system accounts as an "average" behaviour: we do not expect all cells to be exactly in the same state during time. Moreover we know that physically populations are not continues values but change in a discrete way. In order to deal with the implicit stochasticity and diversity of biological system, in the last years stochastic approaches have been investigated. In our case we use an approach based on [http://en.wikipedia.org/wiki/Process_calculi Process Algebras] (as formalism to define the system) and [http://en.wikipedia.org/wiki/CTMC Continuous Time Markov Chain (CTMC)] (as mathematical model). The Process Algebra we use to define the system is [http://www.dcs.ed.ac.uk/pepa/ PEPA], developed in Edinburgh University. For each species, we define a set of PEPA processes, each one representing a possible population level. Then we add some stochastic actions representing the event of expressing a protein or degrading a protein. The PEPA definitions are:
YFP(I)= (YFPexp,rYFPexp).YFP(I+1) + (YFPdeg,rYFPdeg).YFP(I-1)
for 0<I<maxYFP, where maxYFP is the maximal number of molecules of YFP

GFP(I)= (GFPexp,rGFPexp).GFP(I+1) + (GFPdeg,rGFPdeg).GFP(I-1)
for 0<J<maxGFP, where maxGFP is the maximal number of molecules of GFP
FORWARDPHASE= (YFPexp,rYFPexp).FORWARDPHASE + (ChangePhaseToFlipping,rChangePhaseToFlipping).FLIPPINGPHASE1
FLIPPINGPHASE1= (ChangePhaseToBacward,rChangePhaseToBacward).BACKWARDPHASE
FLIPPINGPHASE2= (ChangePhaseToForward,rChangePhaseToForward).FORDWARDPHASE
BACKWARDPHASE= (GFPexp,rGFPexp).BACKWARDPHASE + (ChangePhaseToFlipping,rChangePhaseToFlipping).FLIPPINGPHASE2
The exponential rates are have been derived from the ODEs related parameter or reasoned.
The system initial configuration is:
YFP(initYFP)<YFPexp>FORWARDPHASE<GFPexp>GFP(initGFP)
where initYFP is the initial number of YFP molecules and initiGFP is the initial number of GFP molecules
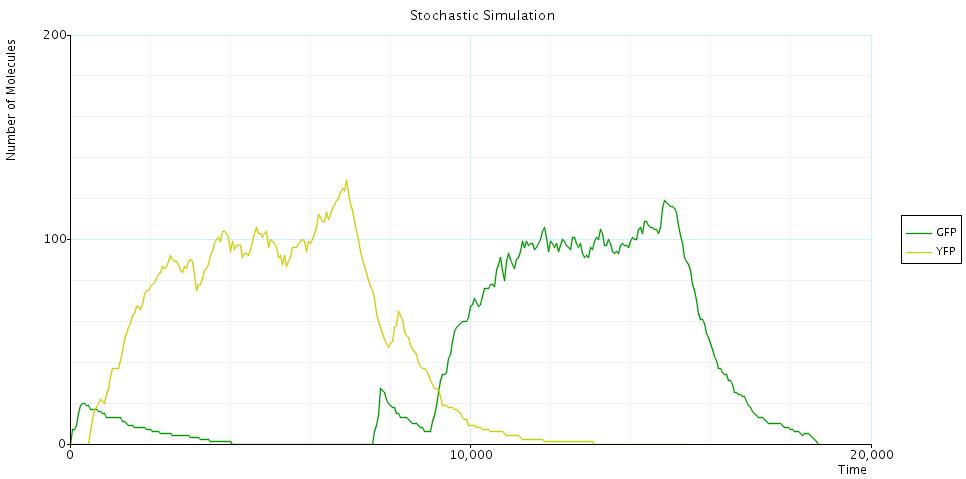
Using CTMC we are forced to use a stochastic event also for division time. We assume the division time and the flipping time to be exponentially distributed. From the initial configuration is possible then to derive the underlying CTMC of the model. Because of the simplicity of the system, we have implemented it directly in [http://www.prismmodelchecker.org/ PRISM] (the code can be downloaded here) and then simulated the CTMC (using the [http://en.wikipedia.org/wiki/Gillespie_algorithm Gillespie Algorithm]). A single simulation looks like:
in detail when switching from one phase to the other.
on a longer run that consider more than one division.
NB: This approach can be used to model more complex systems (pathways and gene networks for examples). A graphical notation used as human interface to process algebra, the theoretical background, guidelines and case studies of this approach are the Master Dissertation topic of one of the team member (Luca Gerosa). The Dissertation PDF can be viewed or downloaded from here.
Results
The ODEs and the stochastic models, not surprisingly, show the same kind of behaviour regarding to the expression and degradation processes. By running sensitivity analysis and comparing simulation runs with different parameter values, it is possible to observe that the most important factor for the functioning of the Proof of Concept construct is the degradation rate of the two fluoresent proteins. This has to be made as fast as possible, for example by addition of rapid-degradation protein tails. The result of a slow protein degradation rate is the continuously high presence of fluoresence for both colours, leading to an inability to observe flipping behaviours. Regarding the cell division duration, the simulation with a duration between 40-80 minutes and a flipping phase of 0-20 minutes has showed to not be influencing adversely the device behaviour. The stochastic simulation permitted the analysis of the behaviour in the case of highly random division frequency in the colony. Although the exponential random distribution seems quite unrealistic for this kind of parameter, it is still interesting to consider that the functions of the test construct don't seem to be altered except in the case of very rapid division.
The Division PoPper device
Modelling a single cell
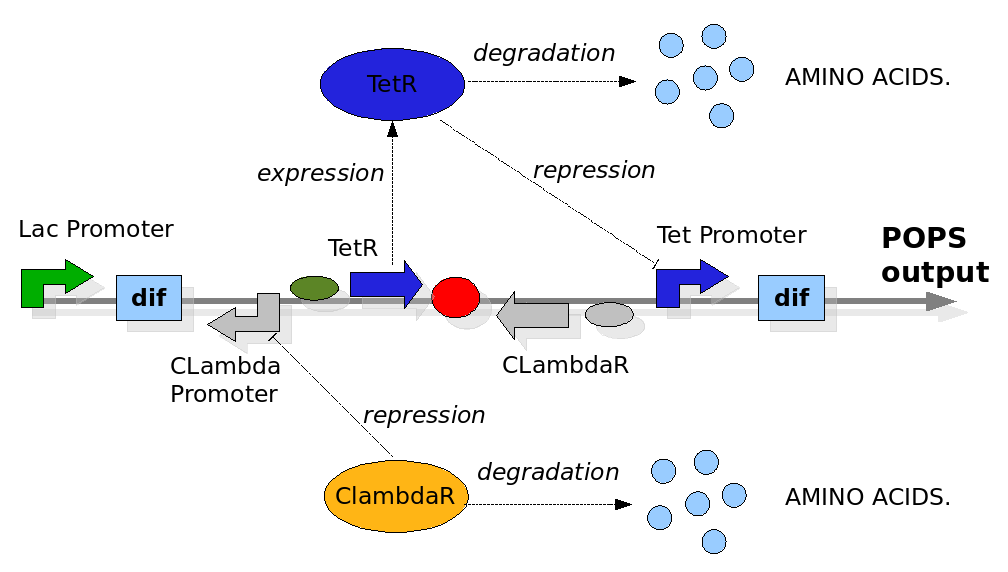
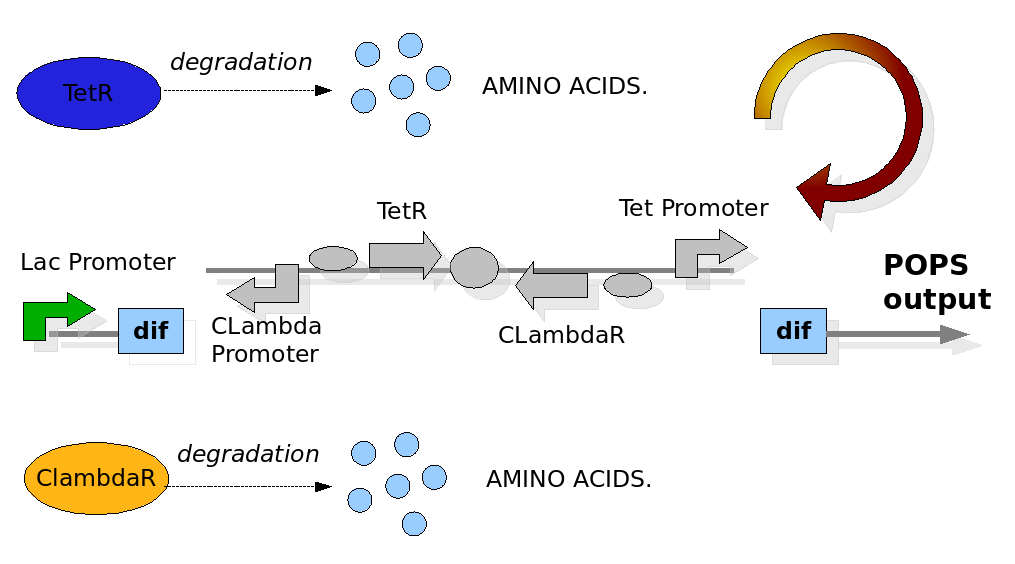
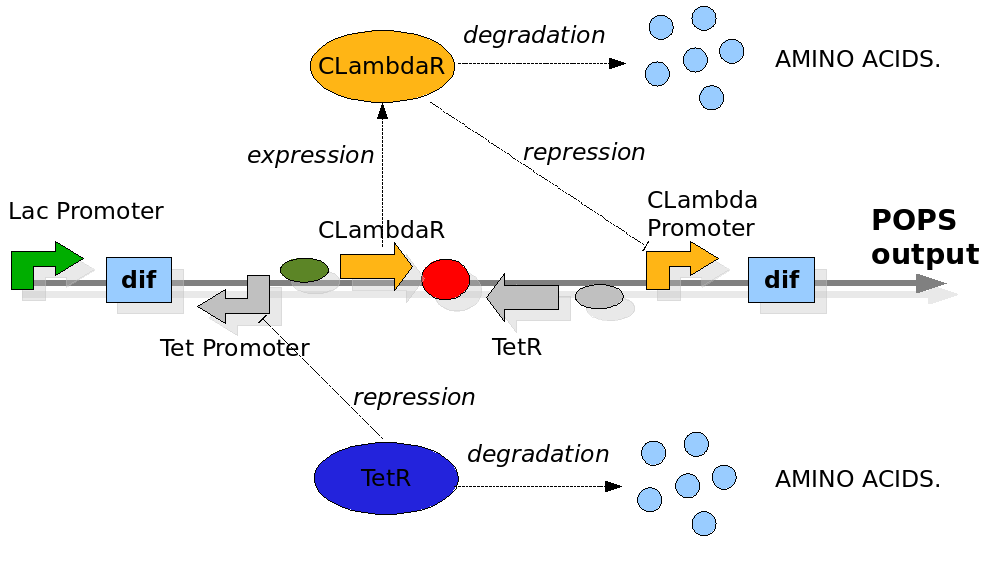
We replicate the same approach used in the Proof of Concept modelling. In this case the configuration of the construct in the different phases and the biological processes involved have been reported in detail in the Design section. The most important differences with the Proof of Concept model are the repression of the Tet and CLambda promoter by the transcriptional factors and the need to model the behaviour of the PoPS signal. The data for the expression and degradation rates and for modelling the repression processes have been taken from peer-reviewed publications as reference values and summarized in the table below:
| Data | Values |
|---|---|
| TetR repressor expression rate | 0.0001 |
| CI lambda repressor expression rate | 0.0001 |
| TetR repressor degradation rate | 0.05 |
| CI lambda repressor degradation rate | 0.05 |
ODEs (deterministic and continuous)
The Division PoPper deterministic model has been constructed for representing two connected but different quantities. The first simulates the behaviour of the device when a reporter protein coding region is placed downstream. This is a classical situation when we try to properly measure the PoPS signal and so is interesting to predict. The second is a model in which we properly represent the pure PoPS signal. The way to model a PoPS behaviour is not a classic of modelling literature, so we add fun in understanding which are the best assumptions and equations to use.
PoPS signal
We need to represent two concentrations that change during time: TetR and CLambdaR. We are also interested in predicting the behaviour of the PoPS signal downstream of the device. While TetR and CLambdaR concentrations are modelled by using ODEs equations, the PoPS signal is modelled as a direct function of repressor concentration during time. We observe that the PoPS signal downstream the Division PoPper is exactly equivalent to the expression rate of a downstream coding region. So the PoPS signal is equivalent to the value of the sigmoidal value we would use to eventually model a protein concentration replenish. This because the behaviour of PoPS can be thought as a sort of step function, in which the PoPS signal is low for a high level of repressor concentration and it increases fast after a "switch point". For this reason we modeled the PoPS signal as a sigmoidal function of the repressor concentration in the cell. The function has been adjusted in order to fit with the values of concentration.
We adjust the sigmoidal function by reversing it on the vertical axis, shifting it to the Switch Point (SP) and by multiplying it for the maximal PoPs value PoPSmax.
With reporter protein
For both repressing systems (Tet and Clamba) we used the PoPS signal simulation for controling the velocity of expression of the repressors concentration in the cell. In order to present the equations we assume that YFP protein coding region has been placed downstream Tet and CLambda promoter.
These are the equations for each phase both for PoPS and with reporting protein quantities:
| Phase | Equations |
|---|---|
| Forward Phase: | d[TetR]/dt = TetRexp - TetRdeg * [TetR]
d[CLambdaR]/dt = - CLambdaRdeg * [CLambdaR] [PoPS]= (1-(1/(1+e^(-[TetR+SP]))) * PoPSmax d[YFP]/dt = [PoPS] - YFPdeg * [YFP] |
| Flipping Phase: | d[TetR]/dt = - TetRdeg * [TetR]
d[CLambdaR]/dt = - CLambdaRdeg * [CLambda] [PoPS]= 0 d[YFP]/dt = - YFPdeg * [YFP] |
| Backward Phase: | d[TetR]/dt = - TetRdeg * [TetR]
d[CLambdaR]/dt = CLambdaRexp - CLambdaRdeg * [CLambdaR] [PoPS]= (1-(1/(1+e^(-[CLambdaR+SP]))) * PoPSmax d[YFP]/dt = [PoPS] - YFPdeg * [YFP] |
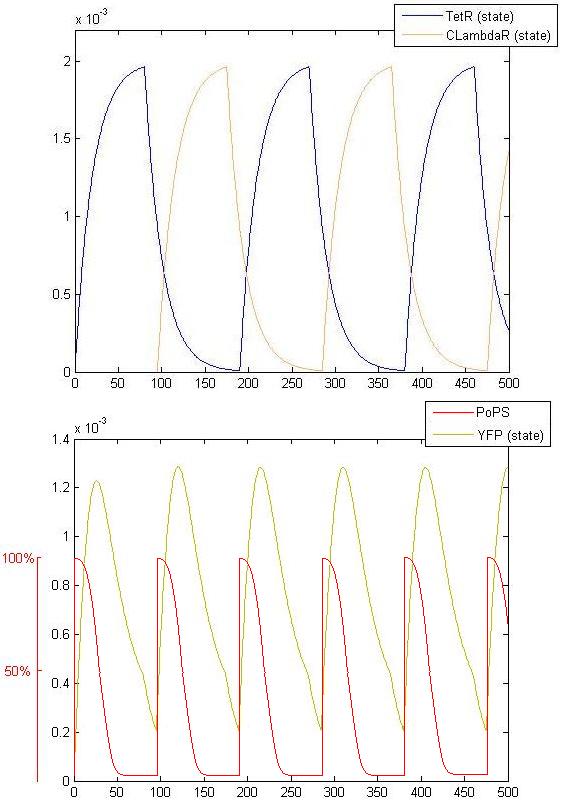
We generated a simulation graph for this set of equations and we divided it in two: the Repressor concentratrion behaviour and the output behaviours.
The SBToolBox code for the DivisionPoPper model can be found here.
Results
The Division PoPper model has been useful to simulate the supposed behaviour of the final construct. We assumed fast degradation rates for the two repressor proteins and a really strong response of the promoters to changes in repressor concentration. This model can be seen as an hypothetical (and regarding some aspects ideal) behaviour under very favorable conditions and functioning of our biological components. Due to lack of published data and uncertaintly in lab values, we are not yet able to confirm the feasibility in terms of time-scale. It seems quite reasonable anyway to be able to adjust them by lengthening in the laboratory the bacterial division duration, for example by using a minimal growth medium or reduced temperature.
The division counter system
As explained in the Applications section, one possible utilisation of the Division PoPper is in counting the number of divisions a cell has undertaken. In order to investigate this possibility on a quantitive base, we tried to combine our ODEs model of the Division PoPper construct to the (ETH Zurich Counter) made for iGEM 2005. ETH Zurich made a really nice mathematical model and published the MATLAB code (Modelling details here ), offering also an interface for external inputs to their device.
ODEs (deterministic and continuous)
(ETH device) implements a quite complex biological mechanisim in order to count how many peaks the PoPS input signal has. We replicated the PoPS output signal of Division PoPper in a MATLAB format and we passed it as input file for the Counter MATLAB program made by ETH Zurich (we made some changes to Zurich code in order to allow full compatibility). In the input file we had to amplify a bit the PoPS signal.. In modelling this is not a problem. In reality this can probably be done by one of the device that will be competing this year (an amplifier, if we are not wrong).. We do love compositionality, because solves problems for you before you encounter them! :P.
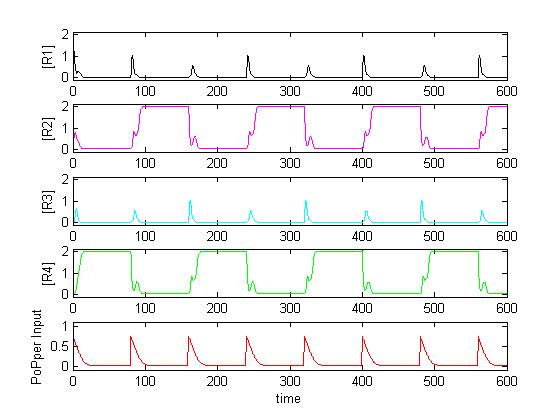
What follow is the prediction made by ETH Zurich model code on our PoPS output signal (input for the Counter).
Results
Looking at the modelled behaviour of the device composed by the Division PoPper and the Counter is possible to see that compatibility is theoretical possible from a qualitative and quantitative point of view. The PoPS signal generate from the Division PopPer, through biological mechanism implemented into the ETH Counter device, is able to cause the rise of R2 at each first peak (thus counting to one) and to rise of R4 at each second following peak (thus counting to two). To confirm that the Counter is working on the PoPS signal, it is possible to see how:
- R1 senses (by going high) the first pulse front
- R2 senses (by going high) the descending front
- R3 senses (by going high) the next pulse front.
- R4 senses (by going high) the next descending front and so on.
References
1. Attila et al. Contributions of low molecule number and chromosomal positioning to Stochastic gene expression. Nature genetics, vol 37, number 9 Sep 2005.
2. Becskei, A., Boselli, M. G. & van Oudenaarden, A. Amplitude control of cell-cycle waves by nuclear import. Nat Cell Biol 6, 451-7 (2004).
3. Chu et al. Orientational control is an efficient control mechanism for phase switching in the E.coli fim system. Journal of Theoretical Biology 244(2007) 541- 551.
4. David Braun et al. Parameter estimation for two synthetic gene networks: A case study. IEEE 2005.


