ETHZ/Model
From 2007.igem.org
(→Mathematical Model) |
(→Mathematical Model) |
||
| (16 intermediate revisions not shown) | |||
| Line 1: | Line 1: | ||
| - | [[Image: | + | [[Image:ETHZ_banner.png|830px]] |
<!-- | <!-- | ||
<center>[[ETHZ | Main Page]] [[ETHZ/Model | System Modeling]] [[ETHZ/Simulation | Simulations]] [[ETHZ/Biology | System Implementation]] [[ETHZ/Biology/Lab| Lab Notes]] [[ETHZ/Meet_the_team | Meet the Team]] [[ETHZ/Internal | Team Notes]] [[ETHZ/Pictures | Pictures!]]</center><br> | <center>[[ETHZ | Main Page]] [[ETHZ/Model | System Modeling]] [[ETHZ/Simulation | Simulations]] [[ETHZ/Biology | System Implementation]] [[ETHZ/Biology/Lab| Lab Notes]] [[ETHZ/Meet_the_team | Meet the Team]] [[ETHZ/Internal | Team Notes]] [[ETHZ/Pictures | Pictures!]]</center><br> | ||
| Line 32: | Line 32: | ||
<!--1st drop down menu --> | <!--1st drop down menu --> | ||
<div id="dropmenu_home" class="dropmenudiv_a"> | <div id="dropmenu_home" class="dropmenudiv_a"> | ||
| - | <a href="https://2007.igem.org/wiki/index.php?title=ETHZ#Introduction">Introduction | + | <a href="https://2007.igem.org/wiki/index.php?title=ETHZ#Introduction">Introduction</a> |
| - | <a href="https://2007.igem.org/wiki/index.php?title=ETHZ#Team_Members">Team Members | + | <a href="https://2007.igem.org/wiki/index.php?title=ETHZ#Team_Members">Team Members</a> |
| - | <a href="https://2007.igem.org/wiki/index.php?title=ETHZ#Acknowledgments">Acknowledgments | + | <a href="https://2007.igem.org/wiki/index.php?title=ETHZ#Acknowledgments">Acknowledgments</a> |
| - | <a href="https://2007.igem.org/wiki/index.php?title=ETHZ#Site_Map">Site map | + | <a href="https://2007.igem.org/wiki/index.php?title=ETHZ#Site_Map">Site map</a> |
</div> | </div> | ||
| Line 41: | Line 41: | ||
<!--2nd drop down menu --> | <!--2nd drop down menu --> | ||
<div id="dropmenu_modeling" class="dropmenudiv_a" style="width: 150px;"> | <div id="dropmenu_modeling" class="dropmenudiv_a" style="width: 150px;"> | ||
| - | <a href="https://2007.igem.org/wiki/index.php?title=ETHZ/Model#Introduction">Introduction | + | <a href="https://2007.igem.org/wiki/index.php?title=ETHZ/Model#Introduction">Introduction</a> |
| - | <a href="https://2007.igem.org/wiki/index.php?title=ETHZ/Model#Model_Overview">Model Overview | + | <a href="https://2007.igem.org/wiki/index.php?title=ETHZ/Model#Model_Overview">Model Overview</a> |
| - | <a href="https://2007.igem.org/wiki/index.php?title=ETHZ/Model#Detailed_Model">Detailed Model | + | <a href="https://2007.igem.org/wiki/index.php?title=ETHZ/Model#Detailed_Model">Detailed Model</a> |
| - | <a href="https://2007.igem.org/wiki/index.php?title=ETHZ/Model#Final_Model">Final Model | + | <a href="https://2007.igem.org/wiki/index.php?title=ETHZ/Model#Final_Model">Final Model</a> |
<a href="https://2007.igem.org/wiki/index.php?title=ETHZ/Modeling_Basics">Modeling Basics Page</a> | <a href="https://2007.igem.org/wiki/index.php?title=ETHZ/Modeling_Basics">Modeling Basics Page</a> | ||
| - | <a href="https://2007.igem.org/wiki/index.php?title=ETHZ/Model#Mathematical_Model">Mathematical Model | + | <a href="https://2007.igem.org/wiki/index.php?title=ETHZ/Model#Mathematical_Model">Mathematical Model</a> |
<a href="https://2007.igem.org/wiki/index.php?title=ETHZ/FSM">FSM View Page</a> | <a href="https://2007.igem.org/wiki/index.php?title=ETHZ/FSM">FSM View Page</a> | ||
<a href="https://2007.igem.org/wiki/index.php?title=ETHZ/FlipFlop">Flip-Flop View Page</a> | <a href="https://2007.igem.org/wiki/index.php?title=ETHZ/FlipFlop">Flip-Flop View Page</a> | ||
| Line 54: | Line 54: | ||
<!--3rd drop down menu --> | <!--3rd drop down menu --> | ||
<div id="dropmenu_simulation" class="dropmenudiv_a" style="width: 150px;"> | <div id="dropmenu_simulation" class="dropmenudiv_a" style="width: 150px;"> | ||
| - | <a href="https://2007.igem.org/wiki/index.php?title=ETHZ/Simulation#Introduction">Introduction | + | <a href="https://2007.igem.org/wiki/index.php?title=ETHZ/Simulation#Introduction">Introduction</a> |
| - | <a href="https://2007.igem.org/wiki/index.php?title=ETHZ/Simulation#Simulation_of_Test_Cases">Test Cases | + | <a href="https://2007.igem.org/wiki/index.php?title=ETHZ/Simulation#Simulation_of_Test_Cases">Test Cases</a> |
| - | <a href="https://2007.igem.org/wiki/index.php?title=ETHZ/Simulation#Sensitivity_Analysis">Sensitivity Analysis | + | <a href="https://2007.igem.org/wiki/index.php?title=ETHZ/Simulation#Sensitivity_Analysis">Sensitivity Analysis</a> |
</div> | </div> | ||
<!--4th drop down menu --> | <!--4th drop down menu --> | ||
<div id="dropmenu_biology" class="dropmenudiv_a" style="width: 150px;"> | <div id="dropmenu_biology" class="dropmenudiv_a" style="width: 150px;"> | ||
| - | <a href="https://2007.igem.org/wiki/index.php?title=ETHZ/Biology#Introduction">Introduction | + | <a href="https://2007.igem.org/wiki/index.php?title=ETHZ/Biology#Introduction">Introduction</a> |
| - | <a href="https://2007.igem.org/wiki/index.php?title=ETHZ/Biology#The_Complete_System">The Complete System | + | <a href="https://2007.igem.org/wiki/index.php?title=ETHZ/Biology#The_Complete_System">The Complete System</a> |
| - | <a href="https://2007.igem.org/wiki/index.php?title=ETHZ/Biology#System_Phases">System Phases | + | <a href="https://2007.igem.org/wiki/index.php?title=ETHZ/Biology#System_Phases">System Phases</a> |
| + | <a href="https://2007.igem.org/wiki/index.php?title=ETHZ/Biology#Current_Cloning_Status">Current Cloning Status</a> | ||
<a href="https://2007.igem.org/wiki/index.php?title=ETHZ/Biology/parts">System Parts Page</a> | <a href="https://2007.igem.org/wiki/index.php?title=ETHZ/Biology/parts">System Parts Page</a> | ||
<a href="https://2007.igem.org/wiki/index.php?title=ETHZ/Biology/Lab">Lab Notes Page</a> | <a href="https://2007.igem.org/wiki/index.php?title=ETHZ/Biology/Lab">Lab Notes Page</a> | ||
| Line 94: | Line 95: | ||
The idea behind this protocol is that: | The idea behind this protocol is that: | ||
| - | * The system will be able to learn one of two input signals - | + | * The system will be able to learn one of two input signals - ATC or IPTG - during a learning phase, while a "learning signal" (AHL) is not yet present. Depending on the input it will report by producing either cyan or yellow florescence. |
| - | * Once the system has learned, the inputs - | + | * Once the system has learned, the inputs - ATC or IPTG - can be removed and the system goes into a memory state in the presence of AHL. In this state, no output color is reported. Memorizing is guaranteed by removing the input chemicals. |
| - | * During the recognition phase, the inputs | + | * During the recognition phase, the inputs ATC or IPTG are (re-)inserted. The system reports by changing its color depending on the input and its current memory state. This is why the system has different florescence properties even in the presence of the same input. The recognition phase takes place in the presence of AHL, to keep the memory enabled and avoid another learning phase. Since we would like to separate four different end states, we use four different fluorescent proteins to encode them. |
==Model Overview== | ==Model Overview== | ||
| - | The model for the proposed system is developed using a top-down approach. We start with a black box | + | The model for the proposed system is developed using a top-down approach. We start with a black box as shown in Fig. 2. |
[[Image:ETHZBlackbox.png|thumb|<b>Fig. 2</b>: Black box |280px]] | [[Image:ETHZBlackbox.png|thumb|<b>Fig. 2</b>: Black box |280px]] | ||
| Line 107: | Line 108: | ||
* There are two inputs to be learned/detected/adapted to. | * There are two inputs to be learned/detected/adapted to. | ||
* There is one separate input to switch on the memory. | * There is one separate input to switch on the memory. | ||
| - | * The system has to alternate between at least three states. Hence, we decided to use two state variables - | + | * The system has to alternate between at least three states. Hence, we decided to use two state variables - CI and P22CII (when interpreted as binary variables, in principle allowing for up to four different states). |
* There are four different output signals (synthesis of four fluorescent proteins). One could also decide to take six output signals into account to further distinguish the learning phase from the recognition phase. However, we restricted ourselves to four outputs to reduce the number of genes that are needed to implement the signals. | * There are four different output signals (synthesis of four fluorescent proteins). One could also decide to take six output signals into account to further distinguish the learning phase from the recognition phase. However, we restricted ourselves to four outputs to reduce the number of genes that are needed to implement the signals. | ||
| - | [[Image:ETHZFullsystemmodel.png|left|thumb|<b>Fig. 3</b>: System overview. AHL, IPTG and | + | [[Image:ETHZFullsystemmodel.png|left|thumb|<b>Fig. 3</b>: System overview. AHL, IPTG and ATC pass the cell membrane where they build complexes with the sensor proteins LuxR, LacI and TetR. These sensor proteins and/or complexes are used to control the internal system state: the memory represented by the proteins CI and P22CII (mutually repressing their synthesis) and the sensed input (IPTG, ATC). CFP, RFP, GFP and YFP stand for yellow, red, cyan and green florescent protein, respectively.|420px]] |
However, we had to keep in mind that the proposed system should be implemented in DNA, and that it would be sensitive to noise. As a result, we took several actions to achieve better experimental results and easier DNA construction: | However, we had to keep in mind that the proposed system should be implemented in DNA, and that it would be sensitive to noise. As a result, we took several actions to achieve better experimental results and easier DNA construction: | ||
| - | * To be more robust against perturbations, we coupled the state variables | + | * To be more robust against perturbations, we coupled the state variables CI and P22CII like it is known from toggle switches [1]. Based on this approach, one state variable is depressing the other one, and the system's internal toggle has the possibility of reaching two stable states. |
| - | * Since - due to their size - proteins can only hardly pass the cell membrane (if they are not actively transported through the cell membrane), we decided to use the much smaller inducer molecules AHL, IPTG and | + | * Since - due to their size - proteins can only hardly pass the cell membrane (if they are not actively transported through the cell membrane), we decided to use the much smaller inducer molecules AHL, IPTG and ATC as inputs. However, since these inducers cannot directly act on the transcription of the DNA nor on the production of proteins, we need to produce the sensor proteins LuxR, LacI and TetR that build complexes with AHL, IPTG and ATC, respectively. |
* The sensor proteins and complexes are used to control the memory formation and the production of the florescent reporter proteins CFP, RFP, GFP and YFP.<br><br> | * The sensor proteins and complexes are used to control the memory formation and the production of the florescent reporter proteins CFP, RFP, GFP and YFP.<br><br> | ||
| Line 120: | Line 121: | ||
In order to test our ideas, we came up with a detailed model of all the interactions in the system. | In order to test our ideas, we came up with a detailed model of all the interactions in the system. | ||
| - | After defining the desired behavior of our system (as shown in the introduction) and a [[ETHZ/FSM | formalized | + | After defining the desired behavior of our system (as shown in the introduction) and a [[ETHZ/FSM | formalized description of the system]] we identified necessary biological components and their interactions. As we can observe in Fig. 3, our system is composed from three basic subparts: |
* sensors, | * sensors, | ||
* memory, and | * memory, and | ||
| Line 134: | Line 135: | ||
The second subsystem implements the memory. The memory control is based on the following underlying mechanisms: | The second subsystem implements the memory. The memory control is based on the following underlying mechanisms: | ||
| - | * The sensor proteins form complexes together with the inducers. These complexes are used to activate the transcription of the genes for the proteins | + | * The sensor proteins form complexes together with the inducers. These complexes are used to activate the transcription of the genes for the proteins CI and P22CII. |
| - | * | + | * P22CII and CI repress the DNA transcription of each other, so that the closed loop system behaves as a toggle; a dynamic system with only two possible steady states (see Fig. 6). |
| - | [[Image:ETHZModelLearning.png|center|thumb|<b>Fig. 5</b>: Learning system: Depending on the inputs IPTG or | + | [[Image:ETHZModelLearning.png|center|thumb|<b>Fig. 5</b>: Learning system: Depending on the inputs IPTG or ATC the proteins CI and P22CII are produced.|300px]] |
| - | * Fig. 5 shows the protein production system that is used during the learning phase. During the learning phase, there is still no | + | * Fig. 5 shows the protein production system that is used during the learning phase. During the learning phase, there is still no CI or P22CII produced. They are produced, only if either IPTG or ATC is added, respectively. Since no AHL is present, the inner toggle switch (see Figure 6) is turned off. |
| - | [[Image:ETHZModelMemory.png|center|thumb|<b>Fig. 6</b>: Memory system. If AHL is present the production of either | + | [[Image:ETHZModelMemory.png|center|thumb|<b>Fig. 6</b>: Memory system. If AHL is present the production of either CI or P22CII is continued.|420px]] |
| - | * During the memory phase, AHL is added and the IPTG and | + | * During the memory phase, AHL is added and the IPTG and ATC are removed. This is why only the inner toggle switch (see Fig. 6) is turned on while the protein production systems shown in Fig. 5 are deactivated. Depending on what was produced during the learning phase, the production of either CI or P22CII is continued. This is why the system can act as memory, effectively storing the information it is exposed to. |
Based on all the above, we present the final assembly of the memory subsystem in Fig. 7. | Based on all the above, we present the final assembly of the memory subsystem in Fig. 7. | ||
| - | [[Image:Model02b.png|center|thumb|<b>Fig. 7</b>: Final interaction of the learning and memory system. The memory content is represented by the concentrations of the proteins | + | [[Image:Model02b.png|center|thumb|<b>Fig. 7</b>: Final interaction of the learning and memory system. The memory content is represented by the concentrations of the proteins CI and P22CII.|560px]] |
===Reporters=== | ===Reporters=== | ||
| - | Fig. 8 gives an overview of the reporter subsystem. Florescent reporter proteins are expressed depending on the inducer concentrations, and the concentrations of | + | Fig. 8 gives an overview of the reporter subsystem. Florescent reporter proteins are expressed depending on the inducer concentrations, and the concentrations of CI and P22CII. For example, the presence of either TetR or CI will repress the production of YFP. However, if the inducer ATC is present, ATC will bind to TetR which can no longer block the production of YFP. We are using four fluorescent proteins, to encode the steady states of our system at the final recognition stage. In this way, we are able to distinguish between all the different transition paths in the system. |
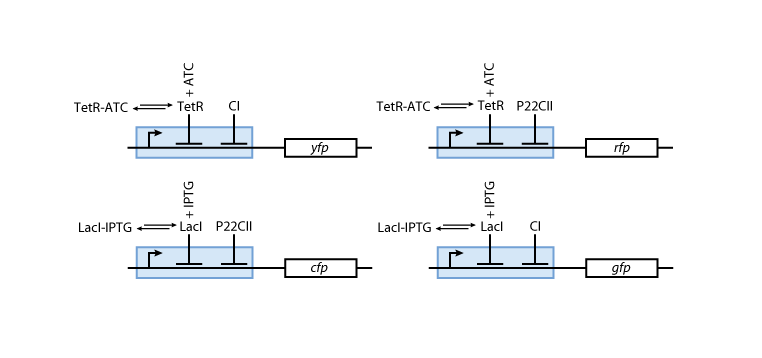
| - | [[Image:Model03b.png|center|thumb|<b>Fig. 8</b>: The production of the florescent reporter proteins depends on the memory content ( | + | [[Image:Model03b.png|center|thumb|<b>Fig. 8</b>: The production of the florescent reporter proteins depends on the memory content (CI or P22CII) and the current input (ATC or IPTG).|600px]] |
| - | ==Final | + | ==Final Design== |
| - | So far, we have presented all parts needed to model and simulate the behavior of the proposed system | + | So far, we have presented all parts needed to model and simulate the behavior of the proposed system. By following the details presented in the previous section, we have all the necessary information to fully understand the interior of the black boxes that were presented in Fig. 2 and Fig. 3. Our overall system model is presented in Fig. 9. |
| - | [[Image:ETHZFullsystem.png|center|thumb|<b>Fig. 9</b>: Final | + | [[Image:ETHZFullsystem.png|center|thumb|<b>Fig. 9</b>: Final design of the educatETH <i>E.coli</i> system.|900px]] |
In contrast to this biological implementation, an alternative implementation using an engineering approach can be found on our [[ETHZ/FlipFlop | 'Engineer's View' page]]. | In contrast to this biological implementation, an alternative implementation using an engineering approach can be found on our [[ETHZ/FlipFlop | 'Engineer's View' page]]. | ||
| Line 166: | Line 167: | ||
Based on the modeling done so far, we can derive the equations that govern the behavior of our system. The model is given by sets of coupled [[ETHZ/Modeling_Basics | ordinary differential equations]] which are presented below. We use a simple notation for the different elements of the equations. Namely: | Based on the modeling done so far, we can derive the equations that govern the behavior of our system. The model is given by sets of coupled [[ETHZ/Modeling_Basics | ordinary differential equations]] which are presented below. We use a simple notation for the different elements of the equations. Namely: | ||
| - | * All concentrations are given in brackets (for example [ | + | * All concentrations are given in brackets (for example [CI]). |
* All decay constants are described by a variable d followed by the name of the protein they refer to. | * All decay constants are described by a variable d followed by the name of the protein they refer to. | ||
* The production of the proteins is described by a basic constant production level named 'a' that models the leak of the production system, and a factor of l and c<sub>max</sub> that describe the maximum production of a protein, given in [M/min]. | * The production of the proteins is described by a basic constant production level named 'a' that models the leak of the production system, and a factor of l and c<sub>max</sub> that describe the maximum production of a protein, given in [M/min]. | ||
* Depending on whether the DNA for a protein is implemented on a low or a high copy plasmid, we distinguish between l<sub>lo</sub> and l<sub>hi</sub>, respectively. | * Depending on whether the DNA for a protein is implemented on a low or a high copy plasmid, we distinguish between l<sub>lo</sub> and l<sub>hi</sub>, respectively. | ||
* Dissociation constants are given by 'K' followed by the name of the protein they refer to. | * Dissociation constants are given by 'K' followed by the name of the protein they refer to. | ||
| - | * The Hill | + | * The Hill cooperativities are described by the constants 'n' followed by the name of the protein they refer to. |
For a more detailed introduction into how we transferred our model into equations, see the section [[ETHZ/Modeling_Basics|Modeling Basics]].<br> | For a more detailed introduction into how we transferred our model into equations, see the section [[ETHZ/Modeling_Basics|Modeling Basics]].<br> | ||
| Line 179: | Line 180: | ||
These equations describe the formation of complexes between the inducers and sensor proteins. We do not use differential equations, but describe directly the concentrations of the complexes. This is a valid assumption, provided that we always wait a sufficient time, and the system reaches a steady state. | These equations describe the formation of complexes between the inducers and sensor proteins. We do not use differential equations, but describe directly the concentrations of the complexes. This is a valid assumption, provided that we always wait a sufficient time, and the system reaches a steady state. | ||
We describe the total amount of proteins with the index 't', while we use the index '*' for proteins that build a complex with their respective inducer. For example: | We describe the total amount of proteins with the index 't', while we use the index '*' for proteins that build a complex with their respective inducer. For example: | ||
| - | * [TetR<sub>t</sub> | + | * [TetR]<sub>t</sub> describes the total concentration of TetR that is available. It is the sum of the free TetR proteins and the TetR proteins that form a complex with ATC. |
| - | * [TetR<sub>*</sub>] describes the proteins that are available as a complex with | + | * [TetR<sub>*</sub>] describes the proteins that are available as a complex with ATC, and |
* [TetR] gives the concentration of free TetR proteins. | * [TetR] gives the concentration of free TetR proteins. | ||
| - | [[Image:Eq04.png| | + | [[Image:Eq04.png|238px]] |
===Constitutively produced proteins=== | ===Constitutively produced proteins=== | ||
| Line 193: | Line 194: | ||
===Learning and memory subsystem=== | ===Learning and memory subsystem=== | ||
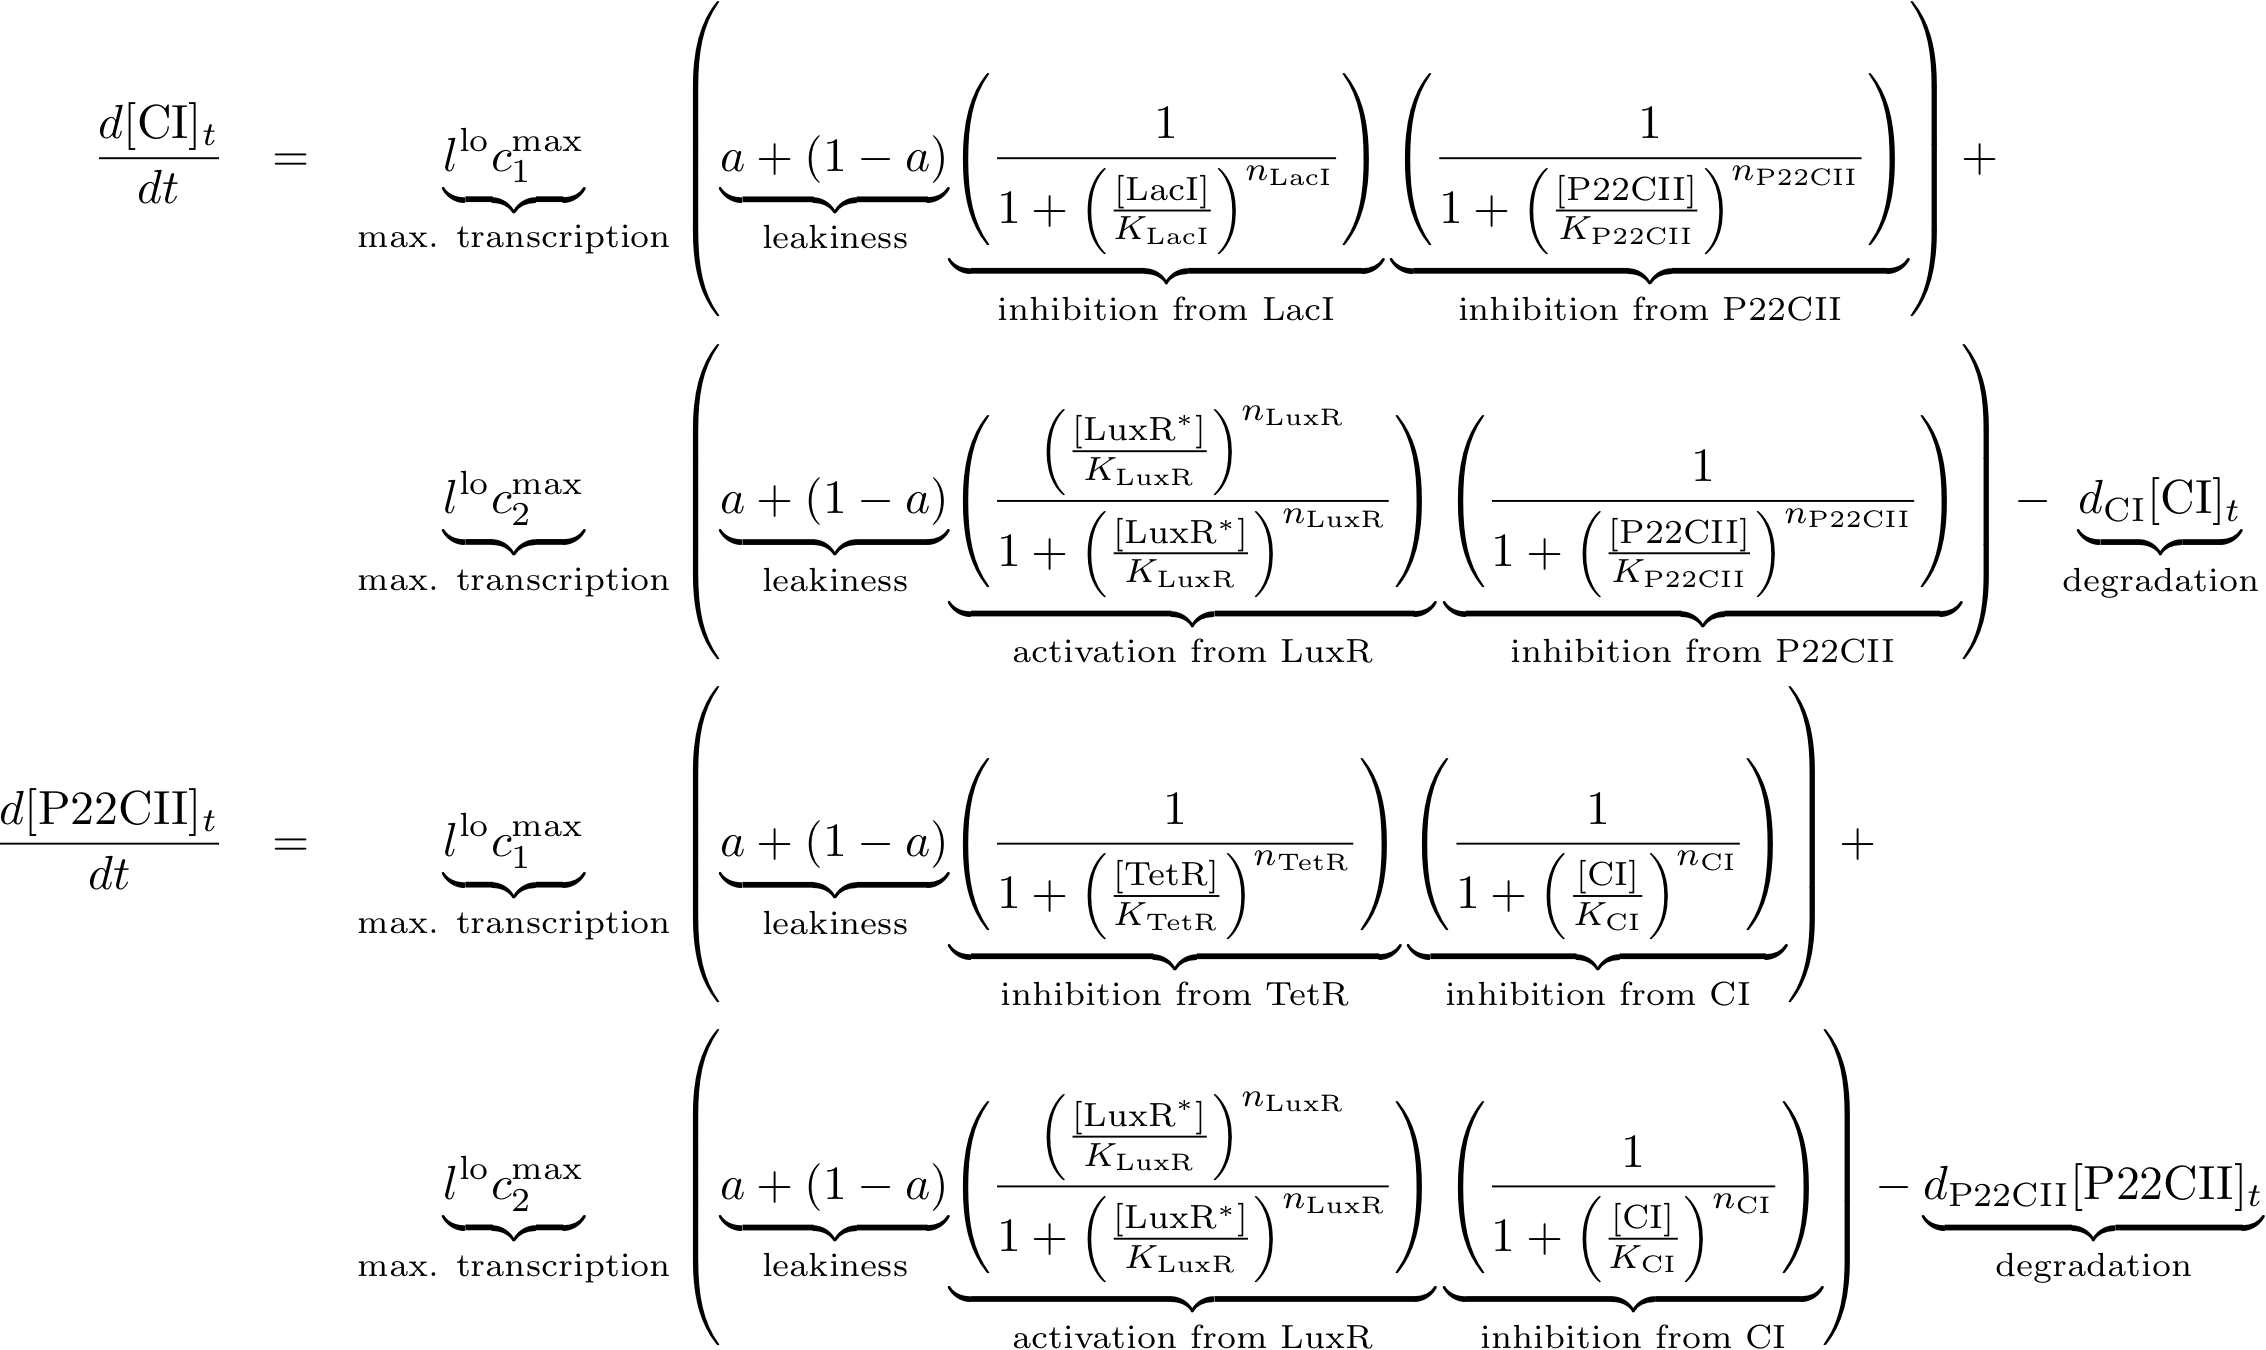
| - | The learning and memory subsystem is the core of the system that we are trying to model and implement. It is characterized by the feedback between its state variables/proteins | + | The learning and memory subsystem is the core of the system that we are trying to model and implement. It is characterized by the feedback between its state variables/proteins CI and P22CII. Its behavior is further complicated by the variation of the production of the aforementioned proteins because of the inputs. The following equations describe the concentrations of the memory proteins as a system of coupled differential equations. The equations consist of two major production parts and a decay part. |
| - | * The first production part models the production of either | + | * The first production part models the production of either CI or P22CII during the learning phase, and corresponds to the model in Fig. 5. |
* The second production part describes the inner toggle switch that was shown in Fig. 6. | * The second production part describes the inner toggle switch that was shown in Fig. 6. | ||
| Line 201: | Line 202: | ||
===Reporting subsystem=== | ===Reporting subsystem=== | ||
| - | The equations for the reporting subsystem finally describe the production of the florescence proteins depending on the inputs and memory proteins as modeled in Figure 8. Note that both the free constitutively produced proteins and the memory proteins repress the production of the florescence proteins. So e.g. YFP is only produced when there is both no | + | The equations for the reporting subsystem finally describe the production of the florescence proteins depending on the inputs and memory proteins as modeled in Figure 8. Note that both the free constitutively produced proteins and the memory proteins repress the production of the florescence proteins. So e.g. YFP is only produced when there is both no CI and all TetR is bound in a complex together with ATC. |
[[Image:Reporter_braced.png|778px]] | [[Image:Reporter_braced.png|778px]] | ||
Latest revision as of 19:29, 26 October 2007
Introduction
As previously discussed in the main page, we are interested in designing a system that is able to adapt to its environment. Our ideas are based on discussions about neural networks, and how we can create a biological system that exhibits the behavior of learning without having to resort to evolutionary processes.
Learning can be considered as a switching of behavior, based on some external stimuli. Thus, it comes naturally to work on existing ideas of toggle switches and finite state machines.
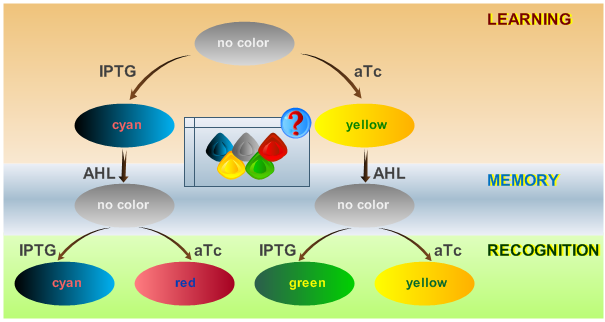
The proposed system is able to distinguish between two chemicals. It represents a minimal test system that is intended as a proof of concept. By introducing the ability to distinguish more than two chemical and thereby introducing new system states, the power of the system or its "intelligence" can be scaled. A protocol depicting how the system should react according to an input is shown in Fig. 1.
The idea behind this protocol is that:
- The system will be able to learn one of two input signals - ATC or IPTG - during a learning phase, while a "learning signal" (AHL) is not yet present. Depending on the input it will report by producing either cyan or yellow florescence.
- Once the system has learned, the inputs - ATC or IPTG - can be removed and the system goes into a memory state in the presence of AHL. In this state, no output color is reported. Memorizing is guaranteed by removing the input chemicals.
- During the recognition phase, the inputs ATC or IPTG are (re-)inserted. The system reports by changing its color depending on the input and its current memory state. This is why the system has different florescence properties even in the presence of the same input. The recognition phase takes place in the presence of AHL, to keep the memory enabled and avoid another learning phase. Since we would like to separate four different end states, we use four different fluorescent proteins to encode them.
Model Overview
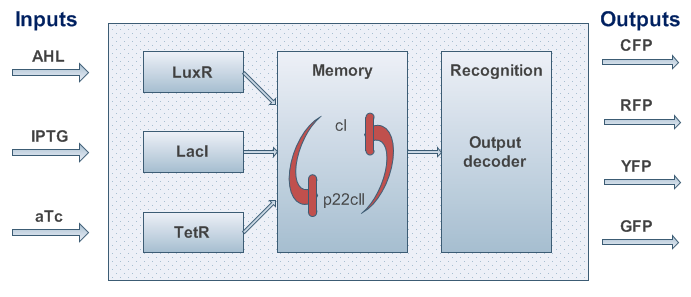
The model for the proposed system is developed using a top-down approach. We start with a black box as shown in Fig. 2.
The system is sketched in Fig. 3. It can be summarized as follows:
- There are two inputs to be learned/detected/adapted to.
- There is one separate input to switch on the memory.
- The system has to alternate between at least three states. Hence, we decided to use two state variables - CI and P22CII (when interpreted as binary variables, in principle allowing for up to four different states).
- There are four different output signals (synthesis of four fluorescent proteins). One could also decide to take six output signals into account to further distinguish the learning phase from the recognition phase. However, we restricted ourselves to four outputs to reduce the number of genes that are needed to implement the signals.
However, we had to keep in mind that the proposed system should be implemented in DNA, and that it would be sensitive to noise. As a result, we took several actions to achieve better experimental results and easier DNA construction:
- To be more robust against perturbations, we coupled the state variables CI and P22CII like it is known from toggle switches [1]. Based on this approach, one state variable is depressing the other one, and the system's internal toggle has the possibility of reaching two stable states.
- Since - due to their size - proteins can only hardly pass the cell membrane (if they are not actively transported through the cell membrane), we decided to use the much smaller inducer molecules AHL, IPTG and ATC as inputs. However, since these inducers cannot directly act on the transcription of the DNA nor on the production of proteins, we need to produce the sensor proteins LuxR, LacI and TetR that build complexes with AHL, IPTG and ATC, respectively.
- The sensor proteins and complexes are used to control the memory formation and the production of the florescent reporter proteins CFP, RFP, GFP and YFP.
Detailed Model
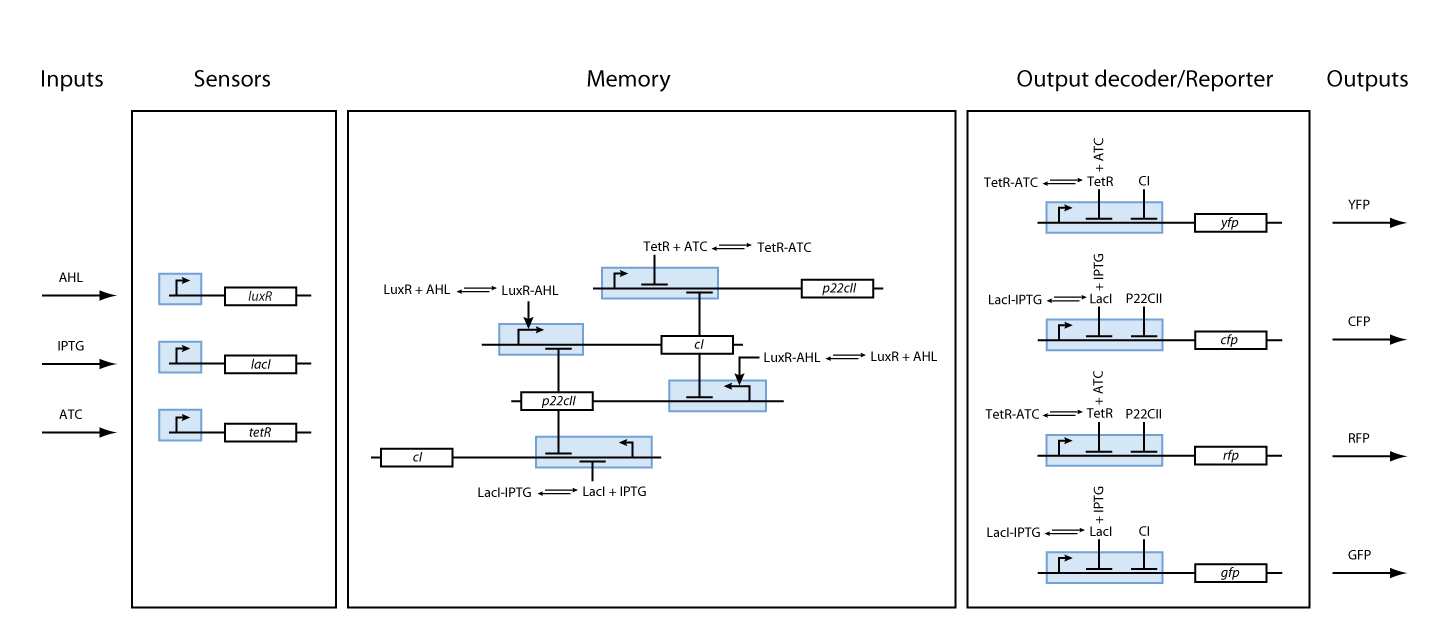
In order to test our ideas, we came up with a detailed model of all the interactions in the system. After defining the desired behavior of our system (as shown in the introduction) and a formalized description of the system we identified necessary biological components and their interactions. As we can observe in Fig. 3, our system is composed from three basic subparts:
- sensors,
- memory, and
- reporters.
Sensors
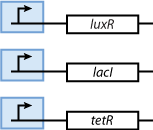
The first part contains the sensors. Our sensors are the proteins LacI, luxR and TetR, which are constitutively produced. The sensing subsystem is shown in Fig. 4.
Memory
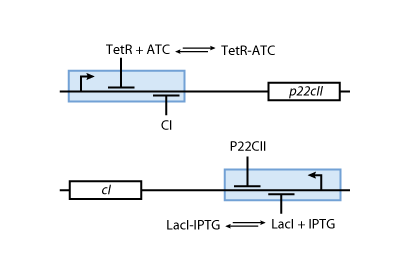
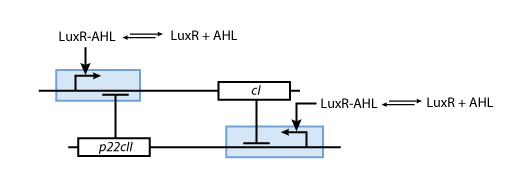
The second subsystem implements the memory. The memory control is based on the following underlying mechanisms:
- The sensor proteins form complexes together with the inducers. These complexes are used to activate the transcription of the genes for the proteins CI and P22CII.
- P22CII and CI repress the DNA transcription of each other, so that the closed loop system behaves as a toggle; a dynamic system with only two possible steady states (see Fig. 6).
- Fig. 5 shows the protein production system that is used during the learning phase. During the learning phase, there is still no CI or P22CII produced. They are produced, only if either IPTG or ATC is added, respectively. Since no AHL is present, the inner toggle switch (see Figure 6) is turned off.
- During the memory phase, AHL is added and the IPTG and ATC are removed. This is why only the inner toggle switch (see Fig. 6) is turned on while the protein production systems shown in Fig. 5 are deactivated. Depending on what was produced during the learning phase, the production of either CI or P22CII is continued. This is why the system can act as memory, effectively storing the information it is exposed to.
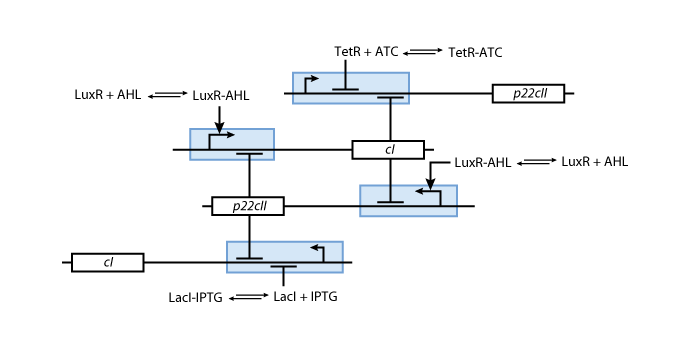
Based on all the above, we present the final assembly of the memory subsystem in Fig. 7.
Reporters
Fig. 8 gives an overview of the reporter subsystem. Florescent reporter proteins are expressed depending on the inducer concentrations, and the concentrations of CI and P22CII. For example, the presence of either TetR or CI will repress the production of YFP. However, if the inducer ATC is present, ATC will bind to TetR which can no longer block the production of YFP. We are using four fluorescent proteins, to encode the steady states of our system at the final recognition stage. In this way, we are able to distinguish between all the different transition paths in the system.
Final Design
So far, we have presented all parts needed to model and simulate the behavior of the proposed system. By following the details presented in the previous section, we have all the necessary information to fully understand the interior of the black boxes that were presented in Fig. 2 and Fig. 3. Our overall system model is presented in Fig. 9.
In contrast to this biological implementation, an alternative implementation using an engineering approach can be found on our 'Engineer's View' page.
Mathematical Model
Based on the modeling done so far, we can derive the equations that govern the behavior of our system. The model is given by sets of coupled ordinary differential equations which are presented below. We use a simple notation for the different elements of the equations. Namely:
- All concentrations are given in brackets (for example [CI]).
- All decay constants are described by a variable d followed by the name of the protein they refer to.
- The production of the proteins is described by a basic constant production level named 'a' that models the leak of the production system, and a factor of l and cmax that describe the maximum production of a protein, given in [M/min].
- Depending on whether the DNA for a protein is implemented on a low or a high copy plasmid, we distinguish between llo and lhi, respectively.
- Dissociation constants are given by 'K' followed by the name of the protein they refer to.
- The Hill cooperativities are described by the constants 'n' followed by the name of the protein they refer to.
For a more detailed introduction into how we transferred our model into equations, see the section Modeling Basics.
Allosteric regulation
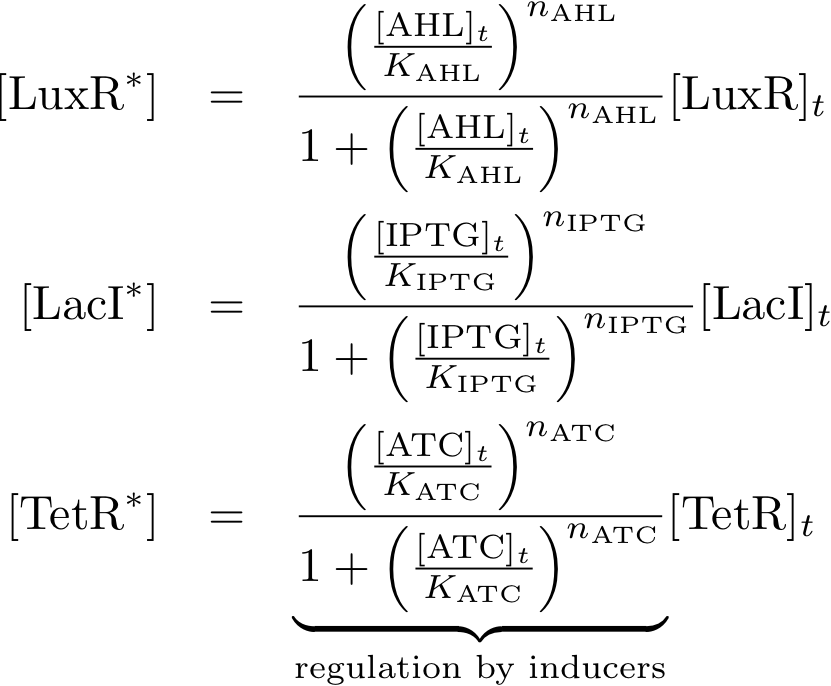
These equations describe the formation of complexes between the inducers and sensor proteins. We do not use differential equations, but describe directly the concentrations of the complexes. This is a valid assumption, provided that we always wait a sufficient time, and the system reaches a steady state. We describe the total amount of proteins with the index 't', while we use the index '*' for proteins that build a complex with their respective inducer. For example:
- [TetR]t describes the total concentration of TetR that is available. It is the sum of the free TetR proteins and the TetR proteins that form a complex with ATC.
- [TetR*] describes the proteins that are available as a complex with ATC, and
- [TetR] gives the concentration of free TetR proteins.
Constitutively produced proteins
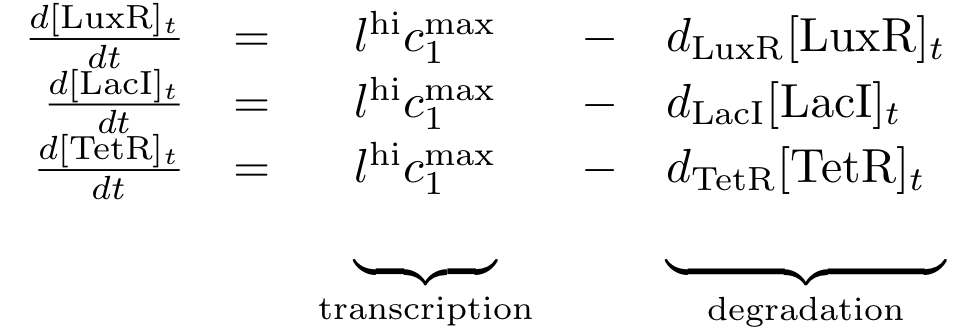
The differential equations for the constitutively produced proteins are very simple, since there is no dependence on other proteins. They are designed so that the protein concentration reaches the value lhi*cmax/d at steady state.
Learning and memory subsystem
The learning and memory subsystem is the core of the system that we are trying to model and implement. It is characterized by the feedback between its state variables/proteins CI and P22CII. Its behavior is further complicated by the variation of the production of the aforementioned proteins because of the inputs. The following equations describe the concentrations of the memory proteins as a system of coupled differential equations. The equations consist of two major production parts and a decay part.
- The first production part models the production of either CI or P22CII during the learning phase, and corresponds to the model in Fig. 5.
- The second production part describes the inner toggle switch that was shown in Fig. 6.
Reporting subsystem
The equations for the reporting subsystem finally describe the production of the florescence proteins depending on the inputs and memory proteins as modeled in Figure 8. Note that both the free constitutively produced proteins and the memory proteins repress the production of the florescence proteins. So e.g. YFP is only produced when there is both no CI and all TetR is bound in a complex together with ATC.
The systems of equations presented above describe and predict the behavior of our system. We have simulated the behavior of our system at steady states, and the results can be seen in the section Simulations. In order to increase the accuracy of our results, we conducted an extensive literature survey, in order to isolate and find the parameters of our system. Since this is a burden for every team undertaking a complicated project in synthetic biology, we are presenting our full table of parameters in the Parameters page.
References
[http://www.nature.com/nature/journal/v403/n6767/abs/403339a0.html [1] Gardner TS, Cantor CR and Collins JJ] "Construction of a genetic toggle switch in Escherichia coli", Nature 403:339–342, 2000


