Virginia Tech/test plasmid
From 2007.igem.org
BlairLyons (Talk | contribs) m |
|||
| Line 72: | Line 72: | ||
| style="padding: 20px; background-color: #FFFFFF;" | | | style="padding: 20px; background-color: #FFFFFF;" | | ||
| - | <h3>In order to track the infection we needed a working reporter plasmid</h3> | + | <h3>In order to track the infection we needed a working reporter plasmid.</h3> |
| - | In | + | In order to test our plasmid, we used the plate reader to determine the levels of red and green fluorescence produced by the culture upon infection. This did not work well because the cells do not fluoresce very brightly, and the background from the liquid or clear plastic kept interfering with the readings. Thus, we decided to utilize microscopy and flow cytometry to show that the plasmid did work. |
| - | + | ||
| - | + | ||
| - | + | ||
| - | + | ||
| - | + | ||
| - | + | ||
| - | + | ||
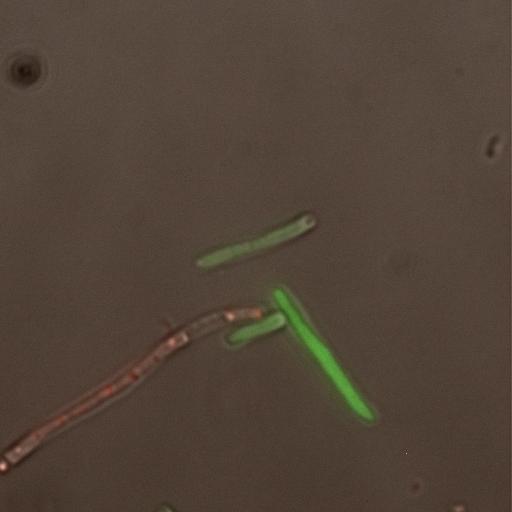
| + | [[Image:Phase fluor combine 082.JPG|thumb|left|400px|'''Infection of LE392 by λ Phage.''' The Green Cells are Lytic while the Red Cell is Lysogenic]] | ||
| + | Flow cytometry showed that there were levels of green and levels of red present. This meant that the reporter plasmid was producing these fluorescent proteins upon infection, but it was also showing readable levels of green fluorescence without infection. This was something that we worried about from the start. It was possible that the promoter for the AcGFP on the reporter plasmid was leaky. The flow cytometer was indicating that this might be true, so we decided to verify it on the microscope. | ||
| + | Utilizing a Deltavision microscope, we looked at cells on an individual basis and excited the fluorescent proteins to glow under the microscope. First we tested cells that were not infected. They did show some green fluorescence, but it was barely higher than the background. It was so low that you actually could not see the green. We then tested the cells at a very low MOI. This showed mainly green cells, thus indicating that the cells would be going lytic. After this, we decided to try a very high MOI, which yielded almost all red cells. Thus indicating that the cells were either already or going to become lysogenic. Lastly, we tried a mid-range MOI that would allow for both red and green cells. The image to the left shows both lytic and lysogenic cells. | ||
|}<html></center></html> | |}<html></center></html> | ||
Revision as of 22:39, 25 October 2007
|
|
In order to track the infection we needed a working reporter plasmid.In order to test our plasmid, we used the plate reader to determine the levels of red and green fluorescence produced by the culture upon infection. This did not work well because the cells do not fluoresce very brightly, and the background from the liquid or clear plastic kept interfering with the readings. Thus, we decided to utilize microscopy and flow cytometry to show that the plasmid did work.
Flow cytometry showed that there were levels of green and levels of red present. This meant that the reporter plasmid was producing these fluorescent proteins upon infection, but it was also showing readable levels of green fluorescence without infection. This was something that we worried about from the start. It was possible that the promoter for the AcGFP on the reporter plasmid was leaky. The flow cytometer was indicating that this might be true, so we decided to verify it on the microscope. Utilizing a Deltavision microscope, we looked at cells on an individual basis and excited the fluorescent proteins to glow under the microscope. First we tested cells that were not infected. They did show some green fluorescence, but it was barely higher than the background. It was so low that you actually could not see the green. We then tested the cells at a very low MOI. This showed mainly green cells, thus indicating that the cells would be going lytic. After this, we decided to try a very high MOI, which yielded almost all red cells. Thus indicating that the cells were either already or going to become lysogenic. Lastly, we tried a mid-range MOI that would allow for both red and green cells. The image to the left shows both lytic and lysogenic cells.
|


