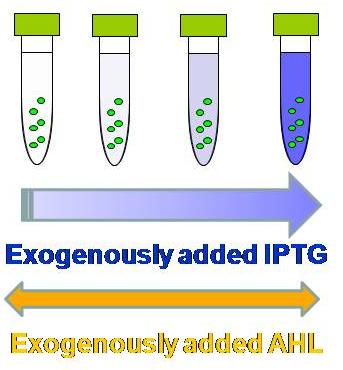
Tokyo/IPTG assay
From 2007.igem.org
(→Result & Conclusion:) |
|||
| Line 33: | Line 33: | ||
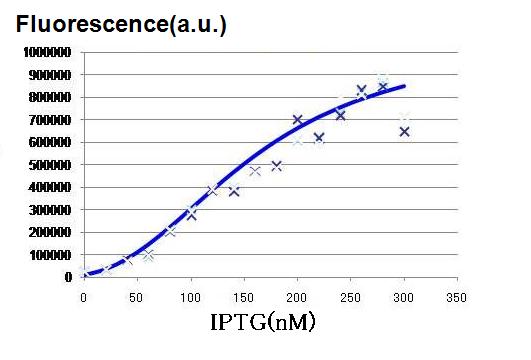
[[Image:hill IPTG.JPG|thumb|200px| '''Fig.2: '''IPTG assay graph]] | [[Image:hill IPTG.JPG|thumb|200px| '''Fig.2: '''IPTG assay graph]] | ||
As the concentration of IPTG increases, GFP fluorescence increased, indicating that the hybrid promoter in the LacI expressing cell became increasingly strengthened by decreasing repression by LacI. The activation graph in Fig. 2, the characteristics of the hybrid promoter expressed in Hill function is determined. | As the concentration of IPTG increases, GFP fluorescence increased, indicating that the hybrid promoter in the LacI expressing cell became increasingly strengthened by decreasing repression by LacI. The activation graph in Fig. 2, the characteristics of the hybrid promoter expressed in Hill function is determined. | ||
| + | |||
| + | <br>'''n3 = 2.47 (-)''' | ||
| + | <br>'''K3 = 0.295 (μM)''' | ||
Revision as of 13:33, 25 October 2007
Works top 0.Hybrid promoter 1.Formulation 2.Assay1 3.Simulation 4.Assay2 5.Future works
Purpose of this assay 1.AHL assay 2.IPTG assay Preliminary assays
IPTG assay
Purpose:
To determine the order of the concentration of IPTG necessary for the activation of our lux-lac hybrid promoter in the LacI producing pTrc99A cells.
The order of the concentration is used for more detailed assay with narrower range of the IPTG concentration.
Samples:
A4 placQI in pTrc99A
A4 ΔP in pTrc99A
Lux-lac hybrid promter + A4 in pBR322
Lux-lac hybrid promter + A4 in pTrc99A
Procedure:
prepare overnight culture for each sample
make fresh culture
take 3 ul of the overinight culture into 3 ml of LB (Amp and/or Kan) in Falcon tubes.
incubate for 2 to 3 hours until the observed OD is around 0.5
add AHL & IPTG solution
[AHL]final (in 3 ml LB culture) = 10 nM
[IPTG]final (in 3 ml LB culture) = 1000, 100, 10, 1, 0.1, 0.01, and 0 mM
incubate for 2 to 3 hours
apply 150 ul of samples into 96-well plaste
FLA measurement
Result & Conclusion:
As the concentration of IPTG increases, GFP fluorescence increased, indicating that the hybrid promoter in the LacI expressing cell became increasingly strengthened by decreasing repression by LacI. The activation graph in Fig. 2, the characteristics of the hybrid promoter expressed in Hill function is determined.
n3 = 2.47 (-)
K3 = 0.295 (μM)

