Glasgow/Plan
From 2007.igem.org
(→Model design: detailed) |
|||
| Line 85: | Line 85: | ||
<center>[[Image:600px-DmpR2.PNG|frame|'''Figure 7:''' The DmpR construct we designed.]]</center> | <center>[[Image:600px-DmpR2.PNG|frame|'''Figure 7:''' The DmpR construct we designed.]]</center> | ||
| - | = Model | + | == <font face=georgia color=#0000FF size=4>Model Design: Detailed</font><br> == |
[[Image: Glasgow_simple_small.png|frame|Figure 3. The simple model]] | [[Image: Glasgow_simple_small.png|frame|Figure 3. The simple model]] | ||
The basic design of our system is shown in Figure 2. The sensing protein TF is produced constitutively. TF stands for one of the sensing proteins that were used in the implemented system - DntR or XylR. TF that is always present in the system binds the signal (pollutant) compound. The TF|S complex promotes expression of the PhzM and PhzS protein coding regions. These proteins catalyse transformation of PCA compound that is available in the system into pyocyanin (PYO). | The basic design of our system is shown in Figure 2. The sensing protein TF is produced constitutively. TF stands for one of the sensing proteins that were used in the implemented system - DntR or XylR. TF that is always present in the system binds the signal (pollutant) compound. The TF|S complex promotes expression of the PhzM and PhzS protein coding regions. These proteins catalyse transformation of PCA compound that is available in the system into pyocyanin (PYO). | ||
Revision as of 13:19, 26 October 2007
 | Back To Glasgow's Main Page |
|---|
| Goals | Results | Sequences | Fuel Cells | References |
ElectrEcoBlu
ElectrEcoBlu combines an environmental biosensor for common organic pollutants with a microbial fuel cell which can produce its own electricity. These cells produce their own electrical power output which increases in the presence of one or more organic pollutant stimulants. This system has the potential to be used for self-powered long term in situ and online monitoring with an electrical readout. It is based around novel reporter genes encoding electron carrying mediators which aid the transfer of electrons from the cells to the electrodes resulting in enhanced electricity generation.
Environmental Biosensors
A biosensor is “a self contained integrated device consisting of a biological recognition element (enzyme, antibody, receptor or microorganism) which is interfaced to a chemical sensor (i.e., analytical device) that together reversibly respond in a concentration-dependent manner to a chemical species” (Rogers et al, 2006). Biosensors offer advantages over current analytical methods for environmental applications such as the possibility of portability and working on-site (Paitan et al, 2003), and being more cost- and time-effective with the ability of measuring pollutants in complex matrices with minimal sample preparation (Ron, 2007). Microorganisms are being developed to exhibit a quick, detectable response to low levels of contamination. These biosensors have the potential to be maintained on-site where they can monitor conditions constantly. For example, biosensors could be used in the soil or water outside of industrial factories to ensure that discharge from the factory is acceptable at all times, or at nuclear reactor sites to make ensure that radioactive materials are not being released into the environment.
Conventional reporter genes that have been used in conjunction with biosensors include Green Fluorescent Protein (GFP), firefly/Renilla luciferase and LacZ. All of these have their disadvantages. Although luciferase offers high sensitivity, it also requires the addition of an expensive substrate and a laboratory based assay using expensive equipment. LacZ also requres addition of a substrate and laboratory based assay, and is not as sensitive as luciferase. GFP is readily detectable in the field, but its high stability means that it will build up in the cell over time and thus contribute to background fluorescence. Each of these methods requires skilled workers and expensive equipment.
Mediator Microbial Fuel Cells
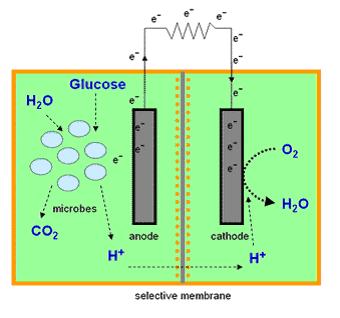
Most microbial cells are electrochemically inactive. The electron transfer from microbial cells to the electrode is facilitated by mediators such as thionine, methyl viologen (methyl blue), neutral red etc, and of the mediators available are expensive and toxic. Microbial fuel cells produce power by use of a microbial cell-permeable chemical mediator, which in the oxidised form intercepts a proportion of NADH (nicotinamide adenine dinucleotide) within the microbial cell and oxidises it to NAD+. The now reduced form of mediator is also cell-permeable and diffuses away from the microbial cell to the anode where, the reduced redox mediator is then electro-catalytically re-oxidised. In addition, cell metabolism produces protons in the anodic chamber, which may migrate through a proton selective membrane to the cathodic chamber. In the latter, they are consumed by ferricyanide (Fe3-(CN)6) and incoming electrons (via the external circuit) reducing it to ferrocyanide (Fe4-(CN)6 ). The oxidised mediator is then free to repeat the cycle. This cycling continually drains off metabolic reducing power from the microbial cells to give electrical power at the electrodes (Figure 2).
See Microbial Fuel Cell Results
Pyocyanin - A Novel Reporter System
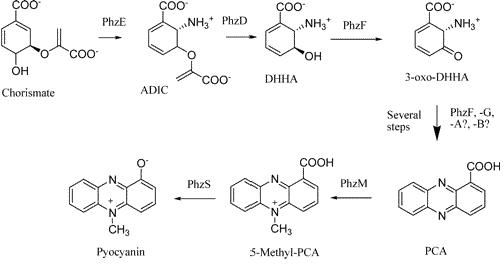
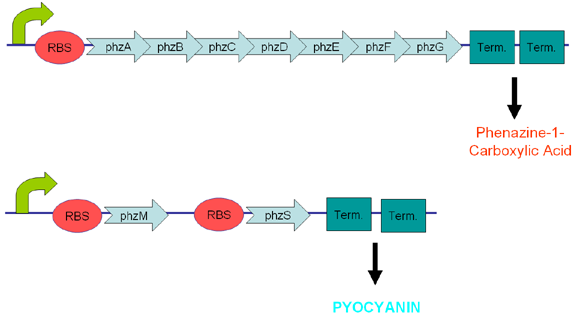
Pyocyanin is a zwitterion synthesised from chorismate by enzymes transcribed from the phz genes in Pseudomonas aeruginosa PA01. Its synthesis is positively regulated by the LysR-like transcriptional activator MvfR (PqsR) through the synthesis of quorum-sensing quinolone molecules. Pyocyanin engages in oxidation-reduction reactions which deplete cells of NADH, glutathione, and other antioxidants, and produces oxidants such as superoxide and peroxides (Parsons, 2006). By isolating the genes phzM, phzS and the seven gene operon phzABCDEFG which express pyocyanin in P. aeruginosa (Figure 3), we intend to harness the oxidation-reduction potential of pyocyanin to power a microbial fuel cell (Figure 4). While using P. aeruginosa in microbial fuel cells is extremely promising in fully exploiting and enhancing this technology, it is clearly necessary to either identify or engineer nonpathogenic bacteria that produce similar redox mediators.
We have attempted to clone the pyocyanin producing genes from P. aeruginosa into E. coli to harvest pyocyanin and therefore electricity from a non-pathogenic organism.
Bacterial Degradation of Organic Pollutants
Many different species of soil- and water-borne bacteria have adapted to the presence of xenobiotic organic molecules in their environment by developing the capacity to use such compounds as carbon sources. These microbes have evolved networks of enzymes by which complex organic compounds are broken down into metabolic intermediates. In many instances, transcription of the genes encoding the enzymes that participate in these degradation pathways is regulated so that expression of these catabolic enzymes is dramatically enhanced by the presence of the compounds that they degrade. This type of transcriptional control is achieved by the interaction of transcriptional activator proteins with specific gene promoters. These proteins contain a DNA binding domain, a transcriptional activation domain, and a recognition domain. Organic molecules bind to the recognition domain and induce a conformational change in the protein that results in enhanced interaction of the DNA binding domain with specific promoter sequences. The complex effectively initiates transcription of the genes encoding the catabolic enzymes that lie directly downstream of the promoter sequence.
XylR and BTEX Chemicals
Benzene, Toluene, Ethylbenzene and Xylenes (BTEX chemicals) are types of volatile organic hydrocarbons found in petroleum derivatives and are used extensively in a wide variety of manufacturing processes. Contamination with BTEX chemicals (so named because they are often found together) is typically located near petroleum and natural gas production sites, and in areas with ground storage tanks.
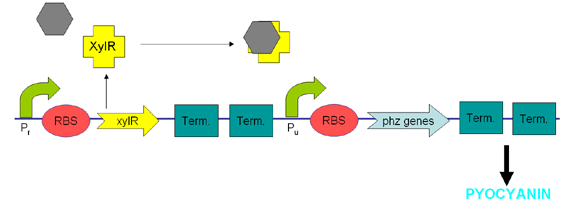
XylR protein, which has evolved in water- and soil-borne bacteria, alters in shape when bound to toluene-like chemicals and forms a transcriptional activator which binds to promoter Pu triggering a cascade of metabolic reactions (Willardson et al, 1998). We intend to use XylR and related promoters Pr and Pu to produce pyocyanin in the presence of toluene (Figure 5).
See XylR and BTEX Chemicals Results
DntR and Dinitrotoluenes
Dinitrotoluene (DNT) is an intermediate in the commercial production of TNT and is often found as an environmental contaminant in areas surrounding production sites. Being toxic and carcinogenic, it is a pollutant of major concern and therefore previous works have been undertaken to characterize the DNT recognition and degradation operons of Burkholderia cepacia strain R34 – an isolate found to be able to utilise 2,4-DNT as its sole carbon source (R.J. Spanggord 1991). During the course of our project we attempted to sub-clone the initial regulatory part of these pathways from a Pseudomonas strain carrying the relevant operon (Rosser & Bruce) with the intention of using it as the sensing component of our biosensor.
The regulatory region consists of a putative LysR-type transcription factor (DntR) consisting of an N-terminal DNA-binding domain and a C-terminal cofactor-binding domain, 301 amino acids in length (Johnson 2002) which recognises 2,4-DNT and positively regulates transcription of an operon encoding components of the 2,4-DNT dioxygenase complex. We designed primers to the 3’ end of DntR and to the region immediately upstream of the first ORF in the operon (Figure 6) resulting in a product that conveniently contained both DntR and its target promoter.
See DntR and Dinitrotoluenes Results
DmpR and Phenolic Compounds
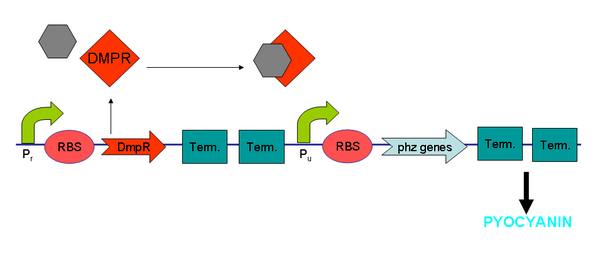
DmpR is a transcriptional activator that is specific for phenol and its derivatives (Figure 7). Phenol and cresols are common toxic environmental pollutants. These compounds enter the environment through processes such as paper pulping and milling. Previous works have been undertaken to characterize the phenol recognition and degradation operons of Pseudomonas sp. strain CF600 – an isolate found to be able to catabolise phenols and cresols (Shingler et al. 1993, Shingler and Moore, 1994).
DmpR is a transcriptional activator that is specific for phenol and its derivatives. The 67-kDa dmpR gene product alone was shown to be sufficient for activation of transcription from the dmp operon promoter. Nucleotide sequence determination revealed that DmpR belongs to the NtrC family of transcriptional activators that regulate transcription from -24, -12 promoters. It was also shown that the amino-terminal region of DmpR shared 64% identity with the amino-terminal region of XylR, which is also a member of this family of activators.
See DmpR and Phenolic Compounds Results
Model Design: Detailed
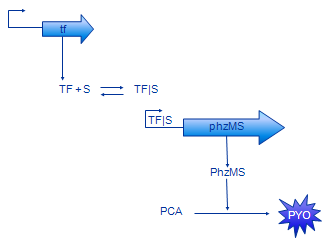
The basic design of our system is shown in Figure 2. The sensing protein TF is produced constitutively. TF stands for one of the sensing proteins that were used in the implemented system - DntR or XylR. TF that is always present in the system binds the signal (pollutant) compound. The TF|S complex promotes expression of the PhzM and PhzS protein coding regions. These proteins catalyse transformation of PCA compound that is available in the system into pyocyanin (PYO).
Two slightly different designs of our system were investigated in the course of the project. The latter is a modification that includes a positive feedback loop in order to enhance system's response to the signal.
Simple Model
In our modelling effort we have simplified the representation of our design to ease modelling. Firstly, we have omitted the intermediate mRNA production and represented gene expression in one step instead. The resulting model contains less parameters, thus is easier to analyse. Also, there are less parameters that need to be found or estimate. In fact, gene expression rate is often measured disregarding mRNA production.
Production of MPCAB (our working name for 5-methylphenazine-1-carboxylic acid betaine - the intermediate compound) has been dropped as well. A study which aimed to characterise this part of the pathway [5] revealed that it is very hard to characterise the PCA -> MPCAB and MPCAB -> PYO reactions separately. This is probably due to instability of MPCAB. The composite reaction PCA -> PYO was characterised instead. Therefore, the MPCAB has been completely removed from the model and the PhzM and PhzS proteins have been joined together into PhzMS.
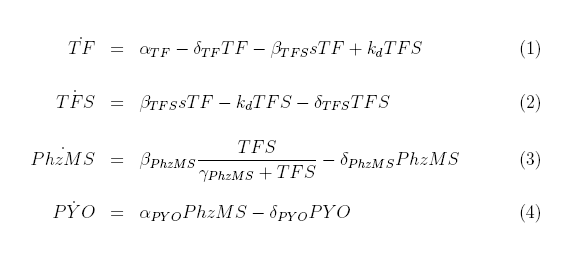
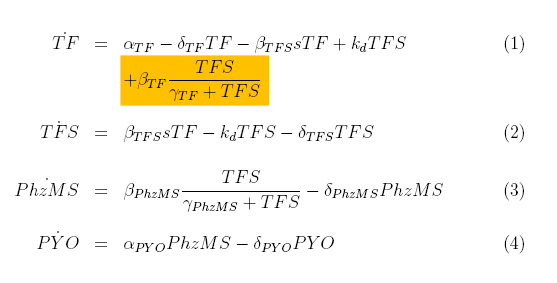
The basic model is shown on the Figure 3. The equations we have developed for it are shown below.
TF protein is produced with constant rate alpha_TF and degrades at rate delta_TF. It also binds to s (pollutant) compounds with rate beta_TFS and unbinds from it with rate k_d.
The first two terms in the TFS equation are equivalent to the two last in the TF equation. The complex also degrades with rate delta_TFS.
We have used Michealis-Mented kinetics to represent production of PhzMS. This protein degrades with rate delta_PhzMS.
Pyocyanin (PYO) is produced depending on the concentration of PhzMS. It degrades with rate delta_PYO.
Positive Feedback Model
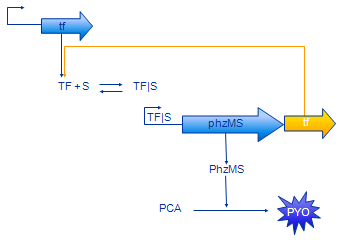
The positive feedback model (Figure 4) includes additional coding region for TF protein placed after PhzMS coding. Once the pollutant is present and expression of reporter proteins is started also more TF is produced. Our assumption was that increased concentration of TF will cause more pollutant molecules to be bound into TF|S complex and, in turn, expression at the TF|S promoter would be enhanced further. The equations we have developed for the positive feedback loop model are as follows.
The only difference between simple model equations and feedback model equations is the term outlined in orange. It represents the additional production of TF.
Simulation
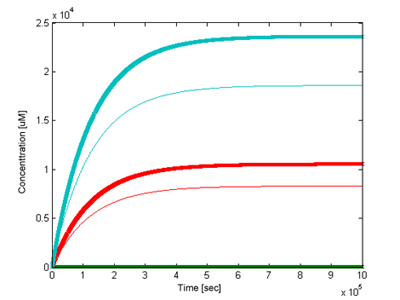
We have been interested how outputs of the two models would differ. Using the most accurate parameter values we could find (see parameter section) and signal concentration of 5uM the two models have been simulated and compared (Figure 5). The version with positive feedback loop gave a sharper and stronger response.
To see the full PDF report [click here].
