Virginia Tech/Updates

From 2007.igem.org

(Difference between revisions)
m
m
Line 49: Line 49:
|}<html></center></html>
|}<html></center></html>
-
 
-
<!--third table: Content-->
 
-
{| cellspacing="0px" border="0" style="width: 800px; color: #000000; background-color: #FFFFFF;"
 
-
 
-
<!--only cell of the third table: Content-->
 
-
| style="padding: 20px; background-color: #FFFFFF;" |
 
-
 
-
<h3>On this page we will periodically publish updates on our progress.</h3>
 
-
We maintain an internal wiki on a daily basis. Here we will post highlights from that wiki as well as important milestones as we reach them. Click one of the section headings below to read about our recent progress.
 
-
 
-
 
-
 
-
[[Virginia_Tech/Updates/Modeling|Modeling]]
 
-
 
-
The model and computer simulations of the infection.
 
-
 
-
• Skip to [[Virginia_Tech/Updates/Modeling/Infection_Model|One Population Infection Model]]
 
-
 
-
• Skip to [[Virginia_Tech/Updates/Modeling/PopInter_Model|Population Interaction Model]]
 
-
 
-
 
-
[[Virginia_Tech/Updates/Phage|Phage Culture]]
 
-
 
-
Growing and manipulating phage lysates, observing their interaction with cells.
 
-
 
-
 
-
[[Virginia_Tech/Updates/Plasmid|Reporter Plasmid]]
 
-
 
-
Engineering the plasmid and transforming it into E. coli.
 
-
 
-
• Skip to [[Virginia_Tech/Updates/Plasmid/Design|Design of the Reporter Plasmid]]
 
-
 
-
 
-
 
-
|}
 
<!--Flow Chart-->
<!--Flow Chart-->
Line 91: Line 56:
<h3>Our project has progressed through many inter-related tasks over the last year.</h3>
-
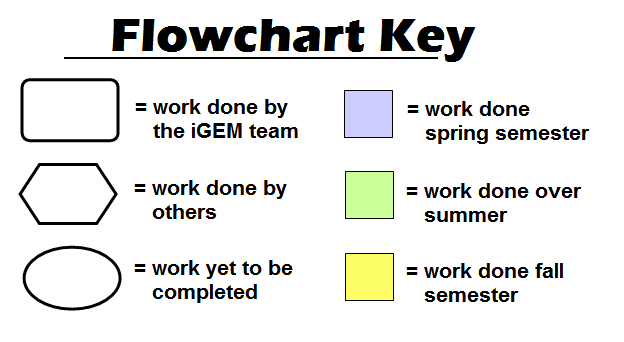
Below is a flowchart of our progress. Use the this key to interpret the chart. Click on any item on the chart to visit a page summarizing that part of our project.
+
Below is a flowchart of our progress. Use the key to interpret the chart. Click on any item on the chart to visit a page summarizing that part of our project.
|style="width: 50px;"|
|style="width: 50px;"|

Revision as of 01:59, 25 October 2007

Title progress.JPG

Dot1.JPG

Dot1.JPG

Dot1.JPG

Dot1.JPG

Dot1.JPG

Our project has progressed through many inter-related tasks over the last year.

Below is a flowchart of our progress. Use the key to interpret the chart. Click on any item on the chart to visit a page summarizing that part of our project.

Key.PNG


Arrows2.PNG

Arrows1.PNG

Arrows3.PNG

Arrows5.PNG

Arrows3.PNG

Arrows5.PNG

Arrows4.PNG

Arrows10.PNG

Arrows6.PNG

Arrows3.PNG

Arrows6.PNG

Arrows7.PNG

Arrows8.PNG

Arrows9.PNG

Arrows9.PNG

Arrows11.PNG

Arrows9.PNG

Arrows9.PNG

Arrows15.PNG

Arrows9.PNG

Arrows12.PNG

Arrows5.PNG

Arrows4.PNG

Arrows14.PNG

Arrows4.PNG

Arrows10.PNG

Arrows13.PNG