Tokyo/Works/Simulation
From 2007.igem.org
| Line 48: | Line 48: | ||
[[Image:2Dpp-ab-tt.JPG|260px|left|thumb|Fig.4.B]] | [[Image:2Dpp-ab-tt.JPG|260px|left|thumb|Fig.4.B]] | ||
[[Image:2Dpp-b-tt.JPG|260px|none|thumb|Fig.4.C]] | [[Image:2Dpp-b-tt.JPG|260px|none|thumb|Fig.4.C]] | ||
| - | <br>Fig.4.A shows that when the two equilibrium points appeared, cells were existing closer to A-side than the unstable | + | <br>Fig.4.A shows that when the two equilibrium points appeared, cells were existing closer to A-side than the unstable equilibrium point. Oppositely,in Fig.4.C,when the two equilibrium points appeared, cells were existing closer to A-side than the unstable equiliblium point. Since when the number of the intersection of nullclines becomes two, stable point appears on B-side, at the moment of Fig.4, cells on the A-side cannot transit to B-side across unstble equilibrium point. As a result, all cells transit to A-side. |
<!--Fig.4.Aでは,平衡点が二つになった瞬間,cellsは中心付近の不安定平衡点よりA側に存在している.逆に,Fig.4.Cでは,平衡点が二つになった瞬間,cellsは中心付近の不安定平衡点よりもB側に存在している. | <!--Fig.4.Aでは,平衡点が二つになった瞬間,cellsは中心付近の不安定平衡点よりA側に存在している.逆に,Fig.4.Cでは,平衡点が二つになった瞬間,cellsは中心付近の不安定平衡点よりもB側に存在している. | ||
Revision as of 10:06, 26 October 2007
Works top 0.Hybrid promoter 1.Formulation 2.Assay1 3.Simulation 4.Assay2 5.Future works
What we have found so far
Wet experiments have determined Hill coefficients, coefficients of repression and activation of AHL and LacI(n2,n3,k2,k3) as follows.
n2 = 2.08 (-)
K2 = 4.05 (μM)
n3 = 2.47 (-)
K3 = 0.295 (μM)
Determining the range of parameter which satisfy coexistent stability
The example of coexistent stable state
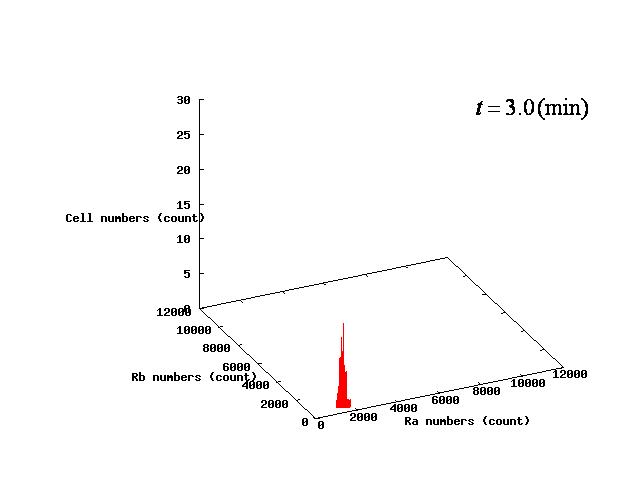
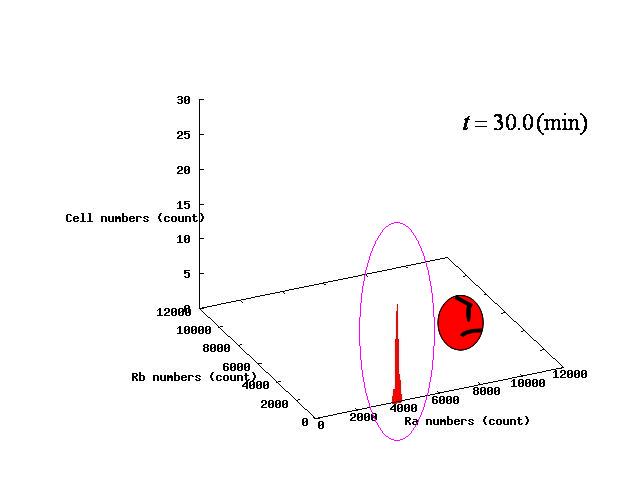
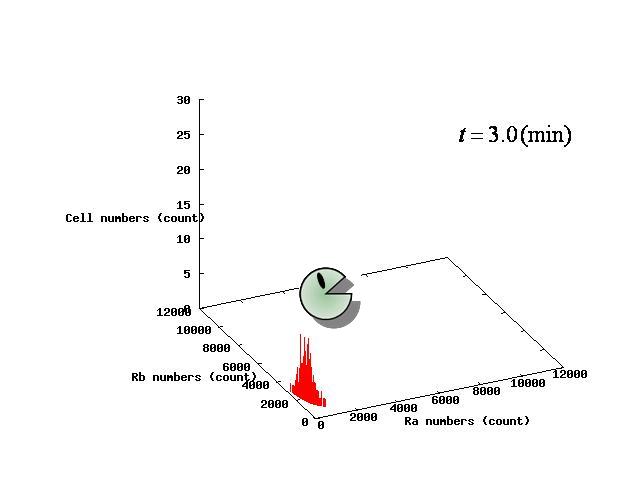
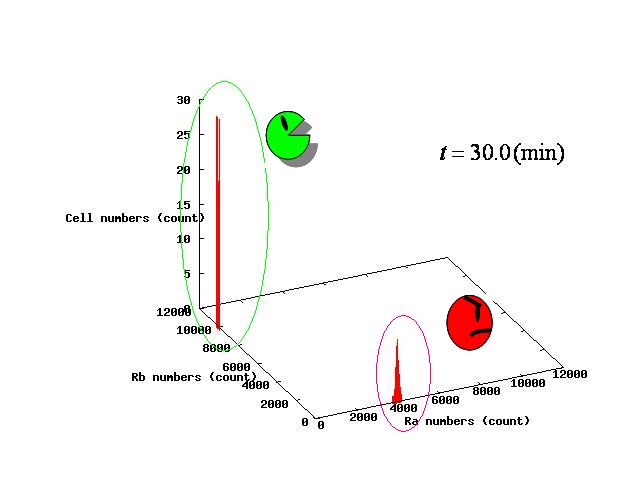
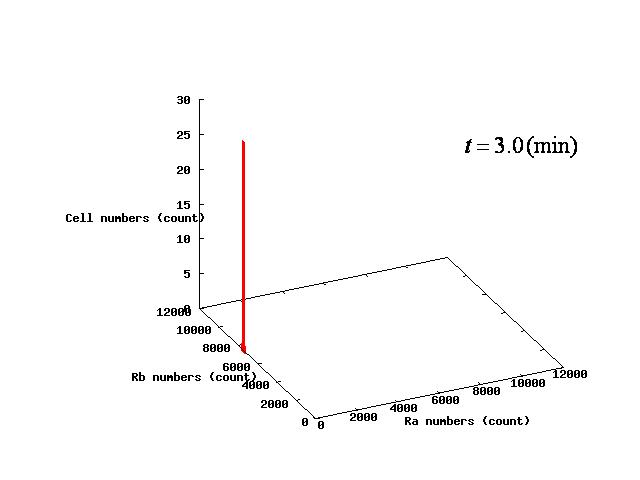
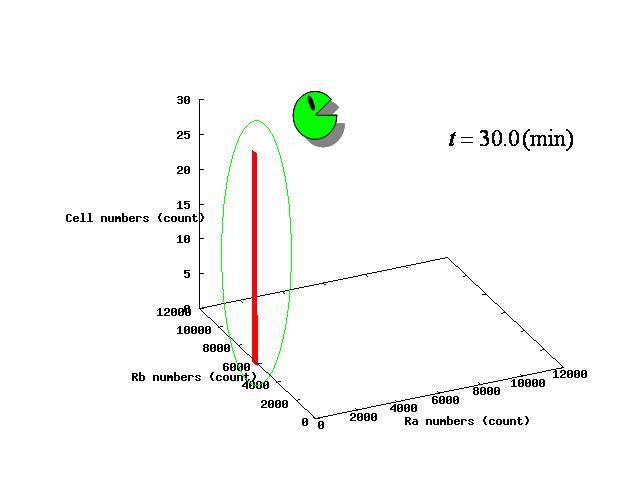
Depending on the value of parameter λ, there are three different patterns:the stable coexistence of A and B pattern, only A pattern, and only B pattern. The simulation result in respect to each pattern is shown in Fig.1 to 3.
⇒ movie here!!
⇒ movie here!!
⇒ movie here!!
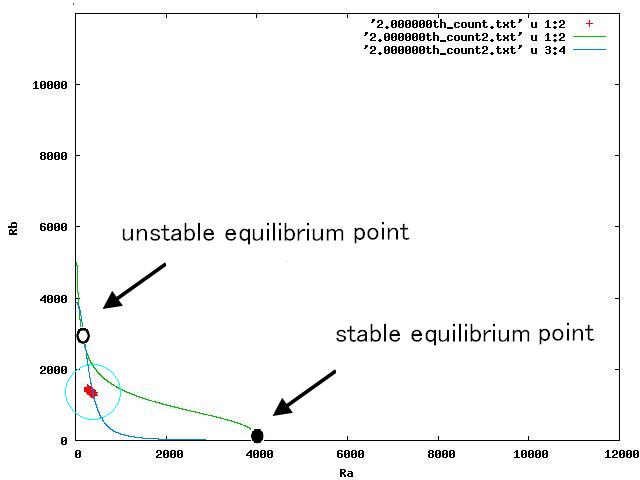
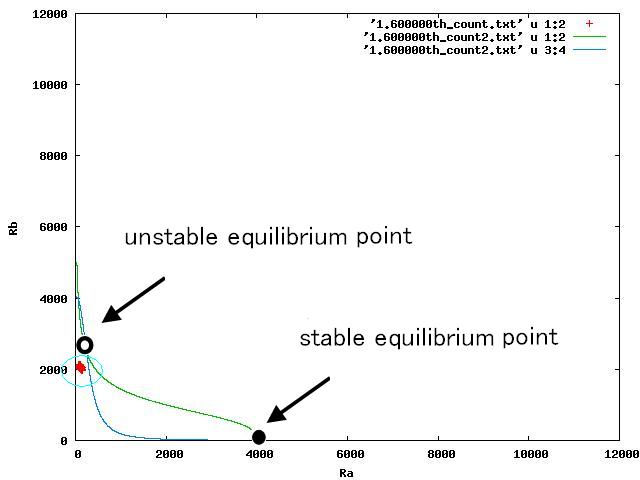
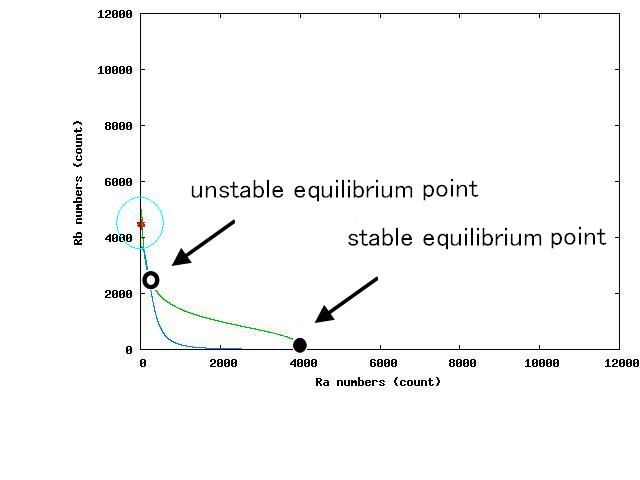
For the three patterns, the phase portraits at the moment when the number of the intersection of nullclines become two are shown in Fig.4.A-C respectively.
Fig.4.A shows that when the two equilibrium points appeared, cells were existing closer to A-side than the unstable equilibrium point. Oppositely,in Fig.4.C,when the two equilibrium points appeared, cells were existing closer to A-side than the unstable equiliblium point. Since when the number of the intersection of nullclines becomes two, stable point appears on B-side, at the moment of Fig.4, cells on the A-side cannot transit to B-side across unstble equilibrium point. As a result, all cells transit to A-side.
⇒ movie about Fig.4.A here!!
⇒ movie about Fig.4.B here!!
⇒ movie about Fig.4.C here!!
The range of parameter λ
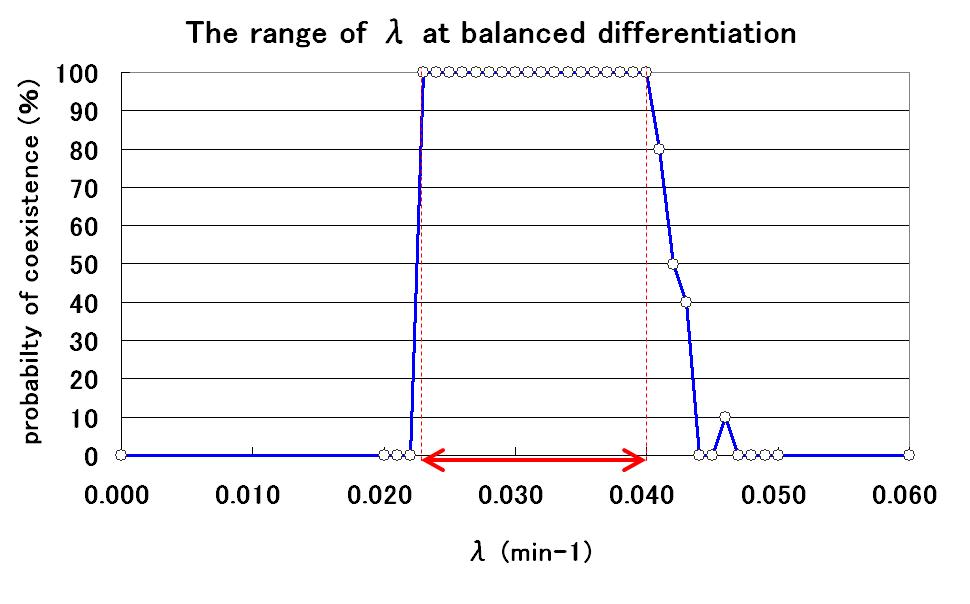
To determine the range of parameter λ, several simulations were conducted with different values of λ. As a result, the relationship between λ value and the probability of coexistence is determined as shown in Fig.5.
By using parameter λ in this range, we can construct our model.
