Imperial/Wet Lab/Results/CBD2.2
From 2007.igem.org
Test for operation at different temperatures for pTet-GFPmut3b
[http://partsregistry.org/Part:BBa_I13522 pTet-GFP]
Aim
The aim of these experiments was to firgure out the operating range of the pTet-GFP construct in-vitro. The temperatures the construct was tested in are: 8°C, 15°C, 25°C, 30°C.
Results
14-09-2007
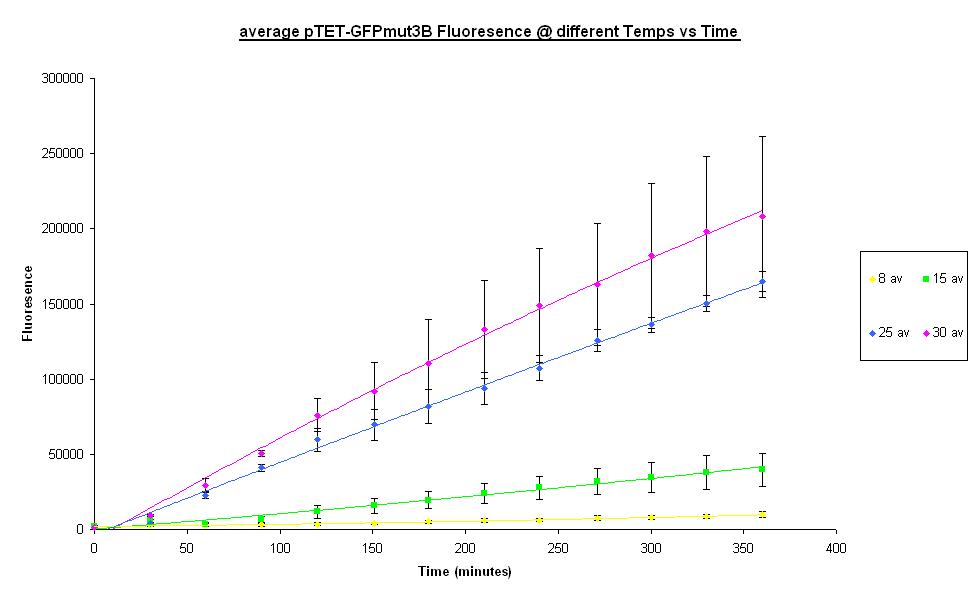
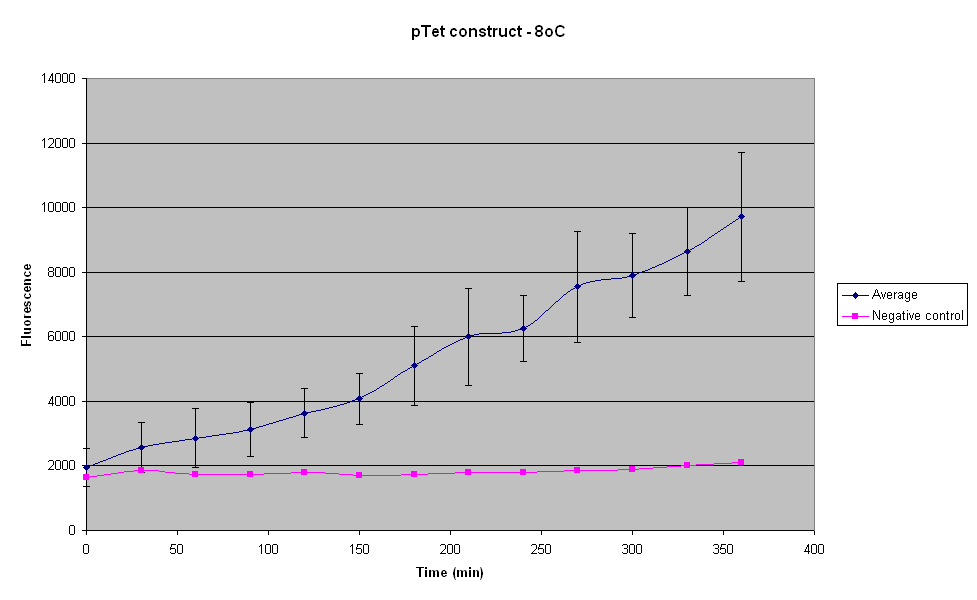
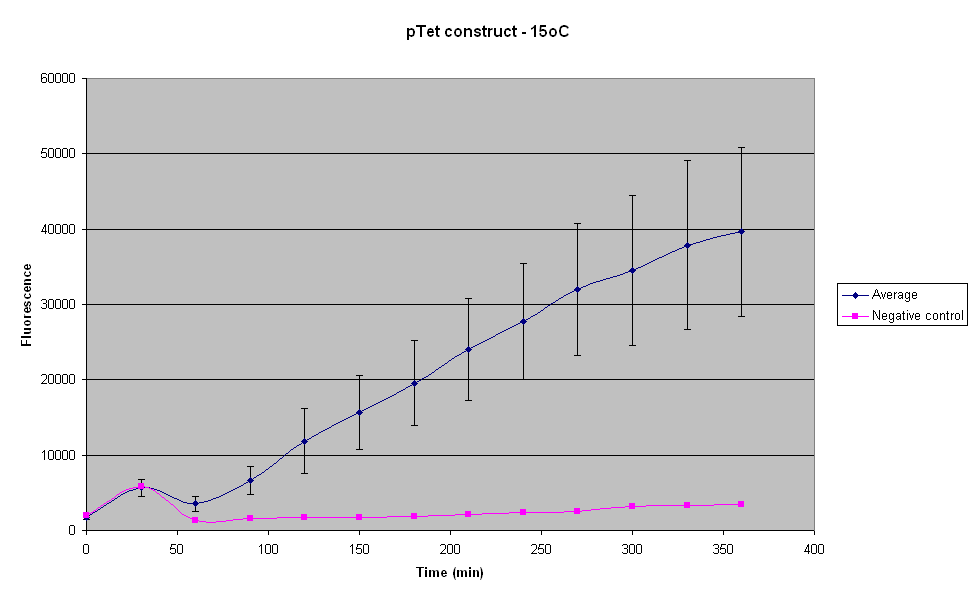
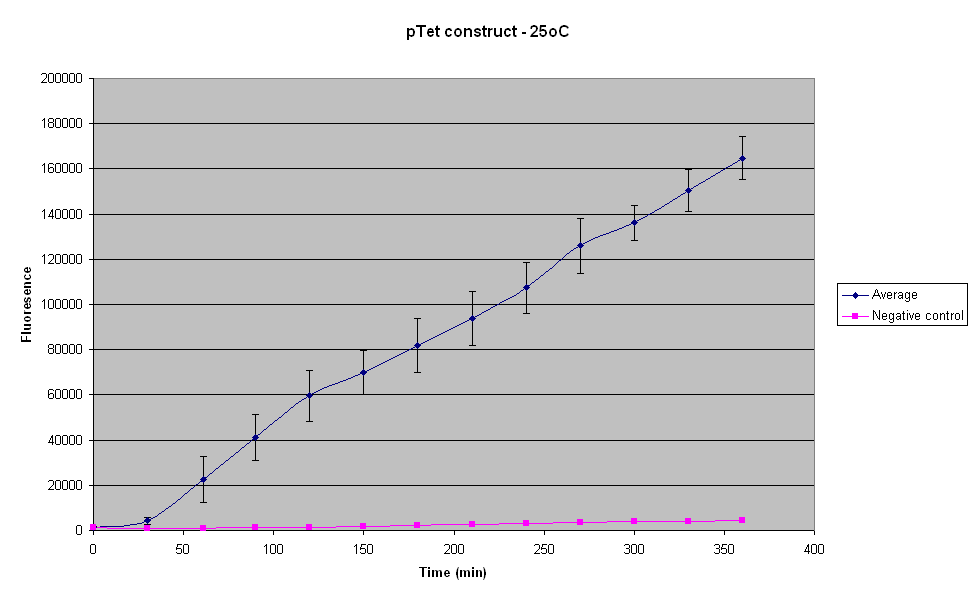
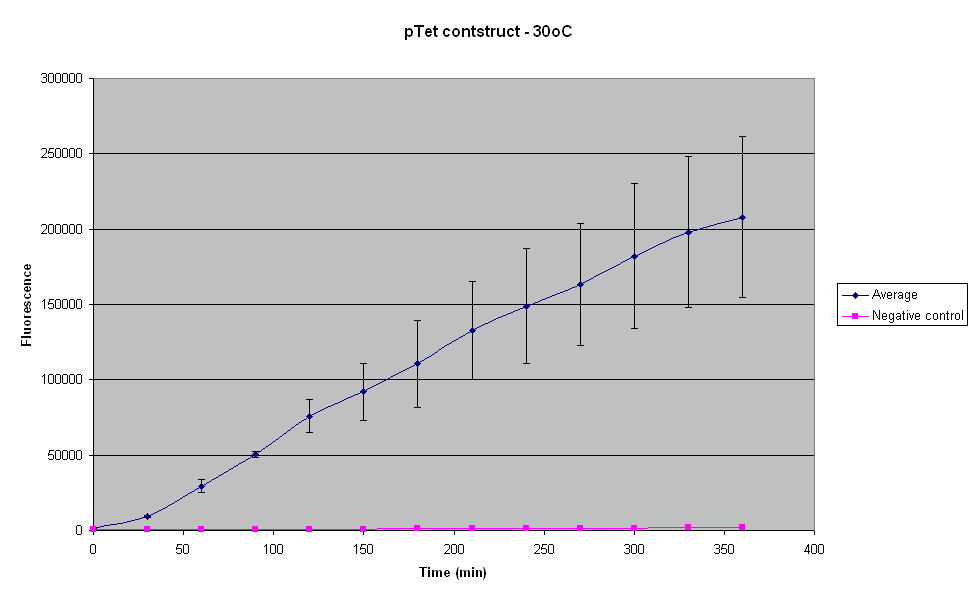
The following graphs show how fluorescence produced by the pTet-GFP construct varied, on average, over time, as compared to the negative control, for different temperatures. The samples were taken every 30 mins over a period of 6hours. There were three samples of cell extract with pTet-GFP DNA and one negative control for each temperature. For each time, four readings were taken for each sample, which were then averaged.
The following graphs show the average fluorescence for the different temperatures, over the three samples, at each time point. The error bars represent the standard deviation between the three samples with the DNA and the cell extract. The negative control for each temperature has also been plotted along with the average fluorescence.
8°C
The fluorescence produced by the construct seems to increase linearly over the 6 hour period. Thus the construct doesn't reach steady state at 8°C over this time period. Testing with UV light revealed that the fluorescence doesn't reach the visual threshold even after 6 hours.
| Complete set of results and raw data |
15°C
The construct seems to produce negligible fluorescence for the first 30mins of the reaction, if the negative control is taken into account. The maximum fluorescence is about 4 times more than that reached when the temperature is 8°C. The fluorescence was not visible at this temperature too, after 6 hours of reaction.
At 30 minutes there seems to be a sudden increase in the fluorescence of the samples as well as the control.
| Complete set of results and raw data |
25°C
The maximum fluorescence reached by the pTet-GFP construct at 25°C is approximately 4 times greater than that reached at 15°C. The highest fluorescence is about 160000, but even that was not visible with UV light.
The standard deviation of the fluorescence between the different samples is the lowest for 25°C compared to the other temperatures. Thus there is least variability in these results.
| Complete set of results and raw data |
30°C
The error between the three samples seems to increase with increasing temperature. Thus the reaction becomes more and more variable as the temperature is increased above 25°C. The fluorescence from the samples at 30°C was also not visible under a UV light.
| Complete set of results and raw data |
Discussion
The results show that the fluorescence produced by the pTet-GFP construct is quite a linear function of time and it increases with increasing temperature. For our applications a visual signal is very important. But after 6 hours of reaction, even with the higest fluorescence, no fluorescence could be visualied with a UV light.
