Tokyo/Works/Assay2
From 2007.igem.org
Works top 0.Hybrid promoter 1.Formulation 2.Assay1 3.Simulation 4.Assay2 5.Future works
Activation check by cell-produced AHL Expression level check on promoters + plasmid sets of A and B sides
Objective
Parameters for the equations in Formulation have been experimentally determined in Assay1. Analysing the result, the following experiments were turned out to be necessary.
Activation check by cell-produced AHL
Objective
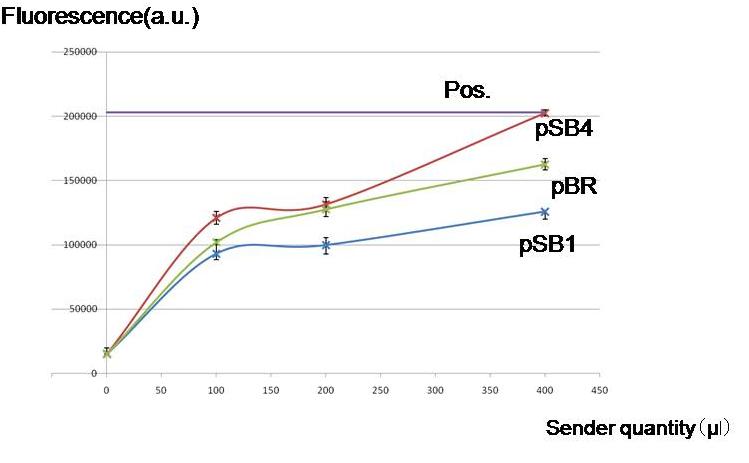
To check whether worker E. coli (Sender) can produce enough amount of AHL for our model to work by using different copy numbers of plasmids
Result & Conclusion
Not only high copy number plasmid pSB1, but also low copy number plasmid pSB4 and pBR produced enough AHL to activate the LacI hybrid promoter in other cells. Especially, pBR remarkably produced AHL in the present experiment.
==> see more details
Expression level check on promoters + plasmid sets of A and B sides
Objective
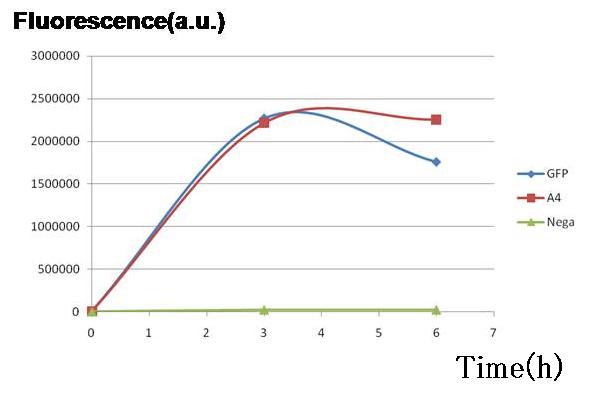
To test and compare the gene expression level of each side, A and B.
Since the cell type - A or B - is detected based on the fluorescence, its activity should be measured and standardized beforehand.
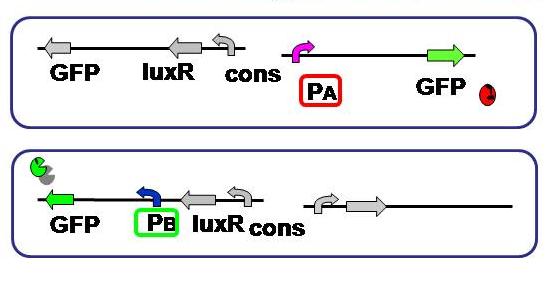
Here we used the same fluorescent protein GFP on the both promoter + plasmid sets actually used in our model, where A side consists of Lambda cI-regulated promoter, and B side the lux lac hybrid promoter.
Result & Conclusion
Two plasmid sets, A4 ΔP/pc1-GFP(upper side of Fig.2, off/on respectively) and A4 hybrid-promoter(+AHL to activate)/pBR322tetR (lower side of Fig.2, on/off respectively), showed almost the same fluorescence of GFP. This result indicates that expression levels of both sets were almost the same, though the latter was a bit smaller.


