Edinburgh/Yoghurt/Modelling
From 2007.igem.org
 Introduction | Applications | Design | Modelling | Wet Lab | Proof of concept | References
Introduction | Applications | Design | Modelling | Wet Lab | Proof of concept | References
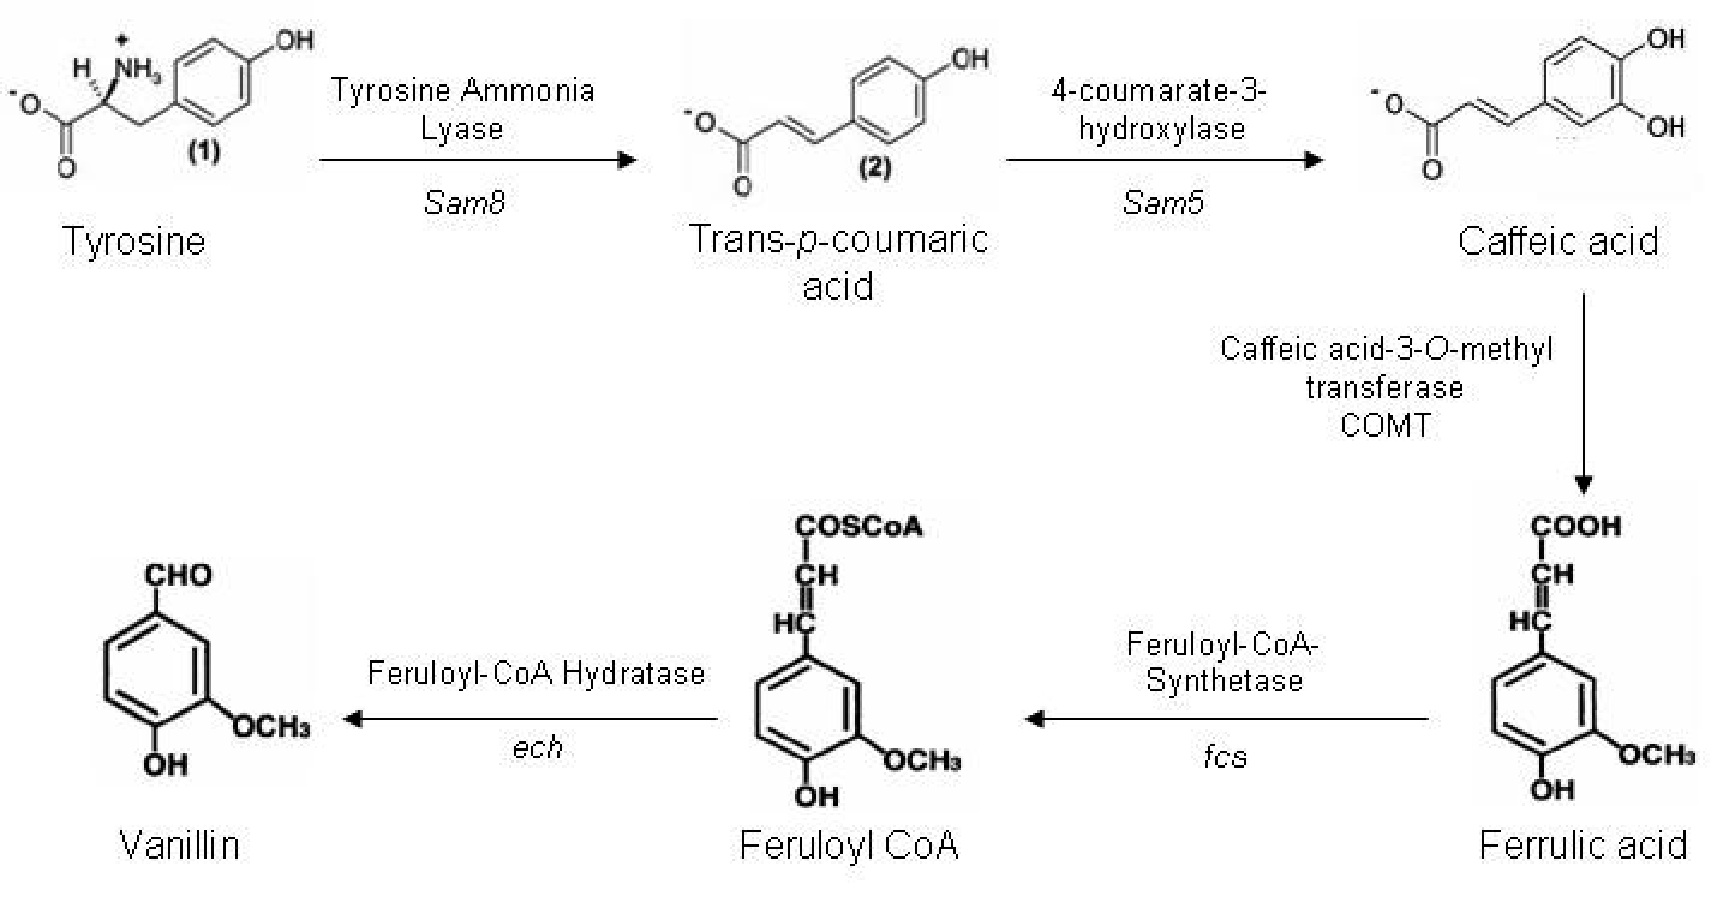
Vanillin Pathway The synthetic pathway to produce vanillin from the amino acid tyrosine is shown below (Fig. 1). There are five genes in this pathway, which are present in three different organisms.
Figure1. The synthesis pathway of vanillin production. (1)
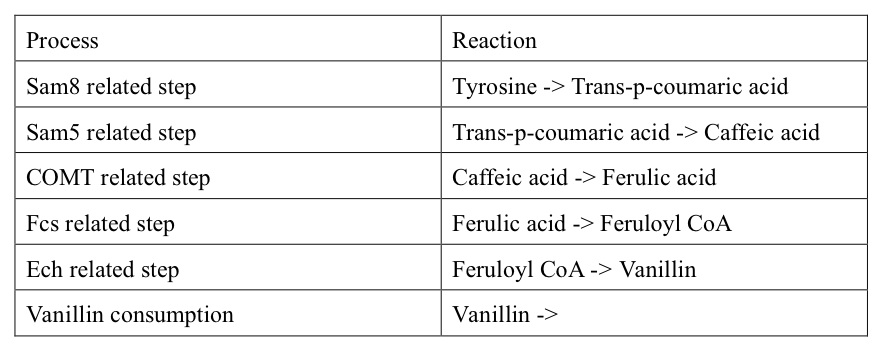
The Sam5 and Sam8 genes are from the microorganism Saccharothrix espanaensis. Sam8 encodes a tyrosine ammonia lyase enzyme, and Sam5 a hydroxylse enzyme. The caffeic acid-3-0- methyltransferase (COMT) gene is part of the lignin biosynthesis pathway present in plants. Both fcs and ech genes are present in a variety of microorganisms. After much searching we have identified ech and fcs genes in Pseudomonas fluorescens, which have a minimal number of forbidden restriction sites. Model of vanillin pathway So far, we have constructed a basal model of vanillin pathway, based on several assumptions. The first and important one is that all the five enzymes related in the pathway are set to be enough. On other word, we did not add the enzyme expression into our model now. It is different from the situation in wet lab, but reasonable bacause the process of vanillin synthesis is in a much longer time course than the enzyme expression. Thus, the concentrations of enzymes can reach a certain level which is enough for vanillin synthesis at the very beginning of the whole pathway. Besides this, we also assume that the concentration of the first substrate Tyrosine is fixed in a certain level and there is a consumption system of vanillin in our model. Therefore, the reactions of vanillin pathway in Copasi are listed below:
Table1. The reactions in vanillin pathway
Results
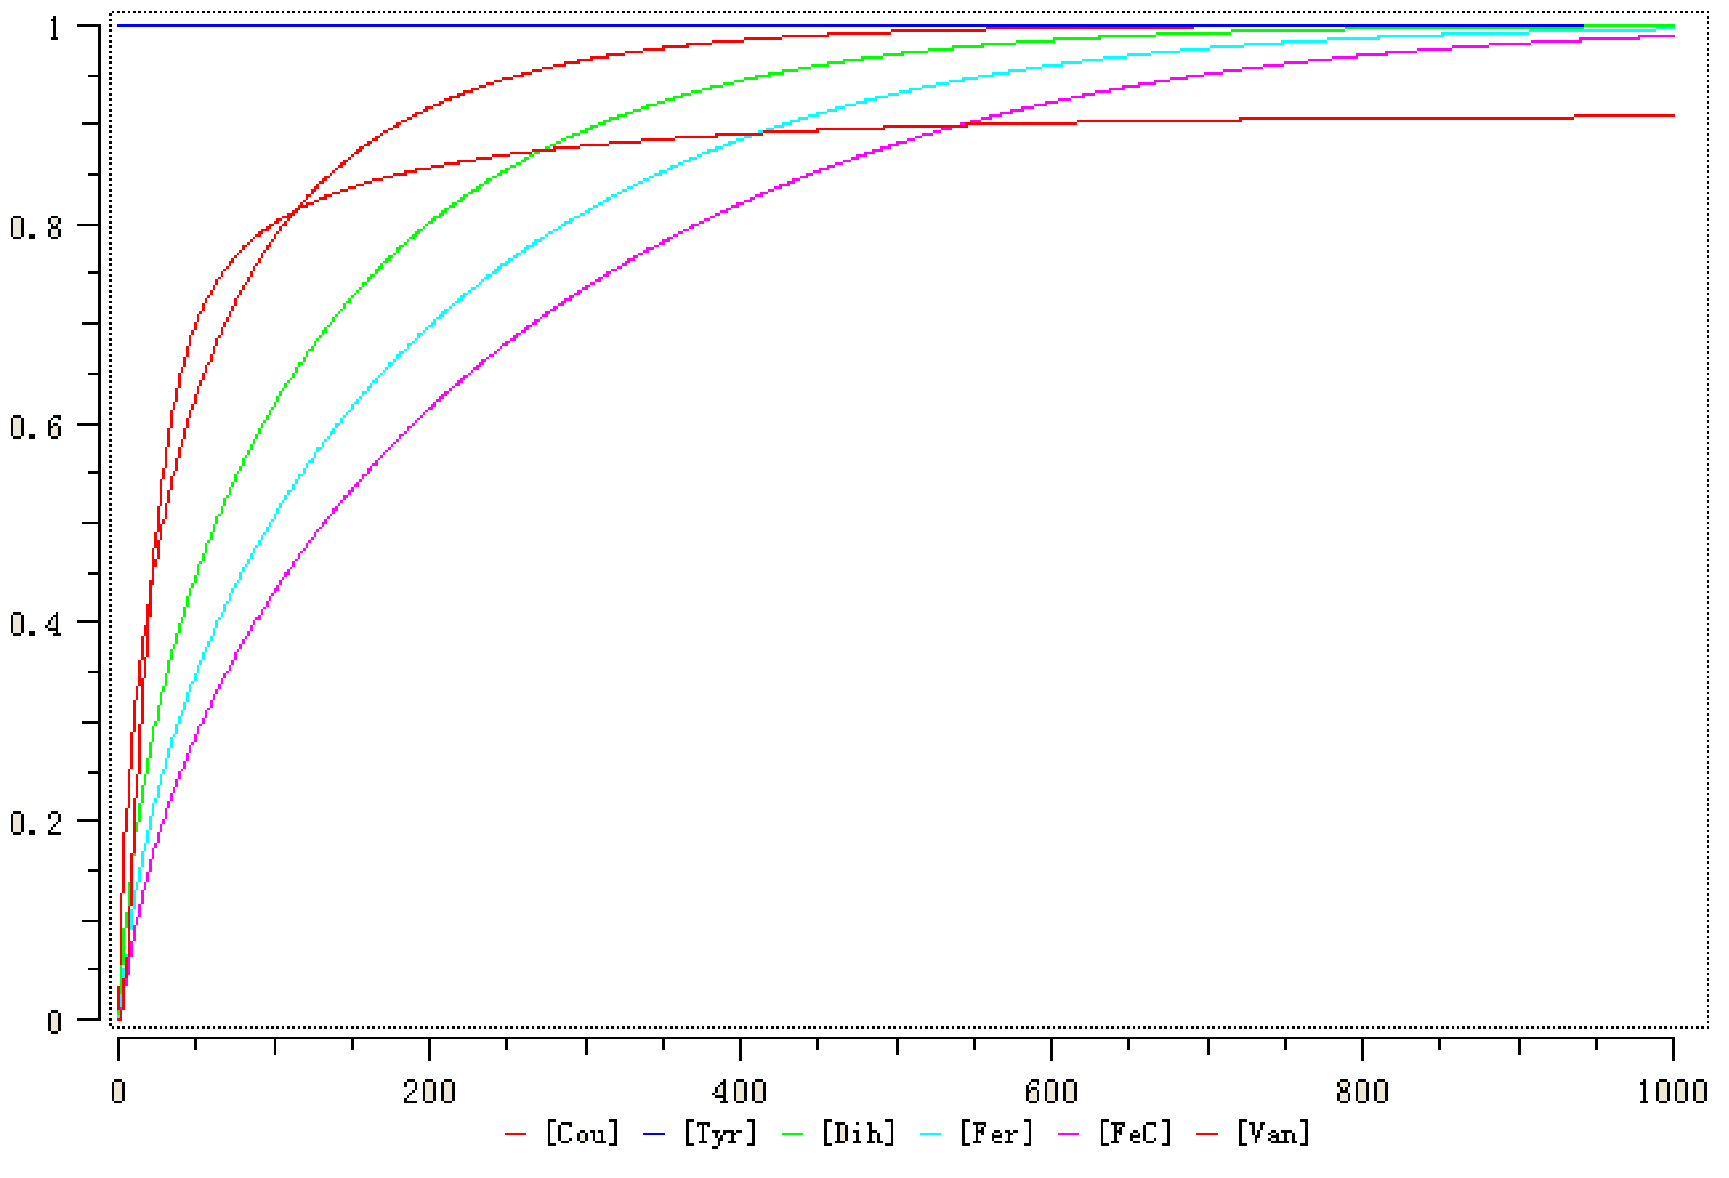
The rates of the first five reactions are Michaelis-Menten equation and Mass equtaion for the vanillin consumption. The simulation result is shown below (Fig. 2). After several time units, the concentration of valillin (red curve) will stay in a steay state (around 0.9 mmol/ml).
Figure2. The concentration of substances in vanillin pathway
Unit: Concentration: mmol/ml; Time: s.
6.5 Future work
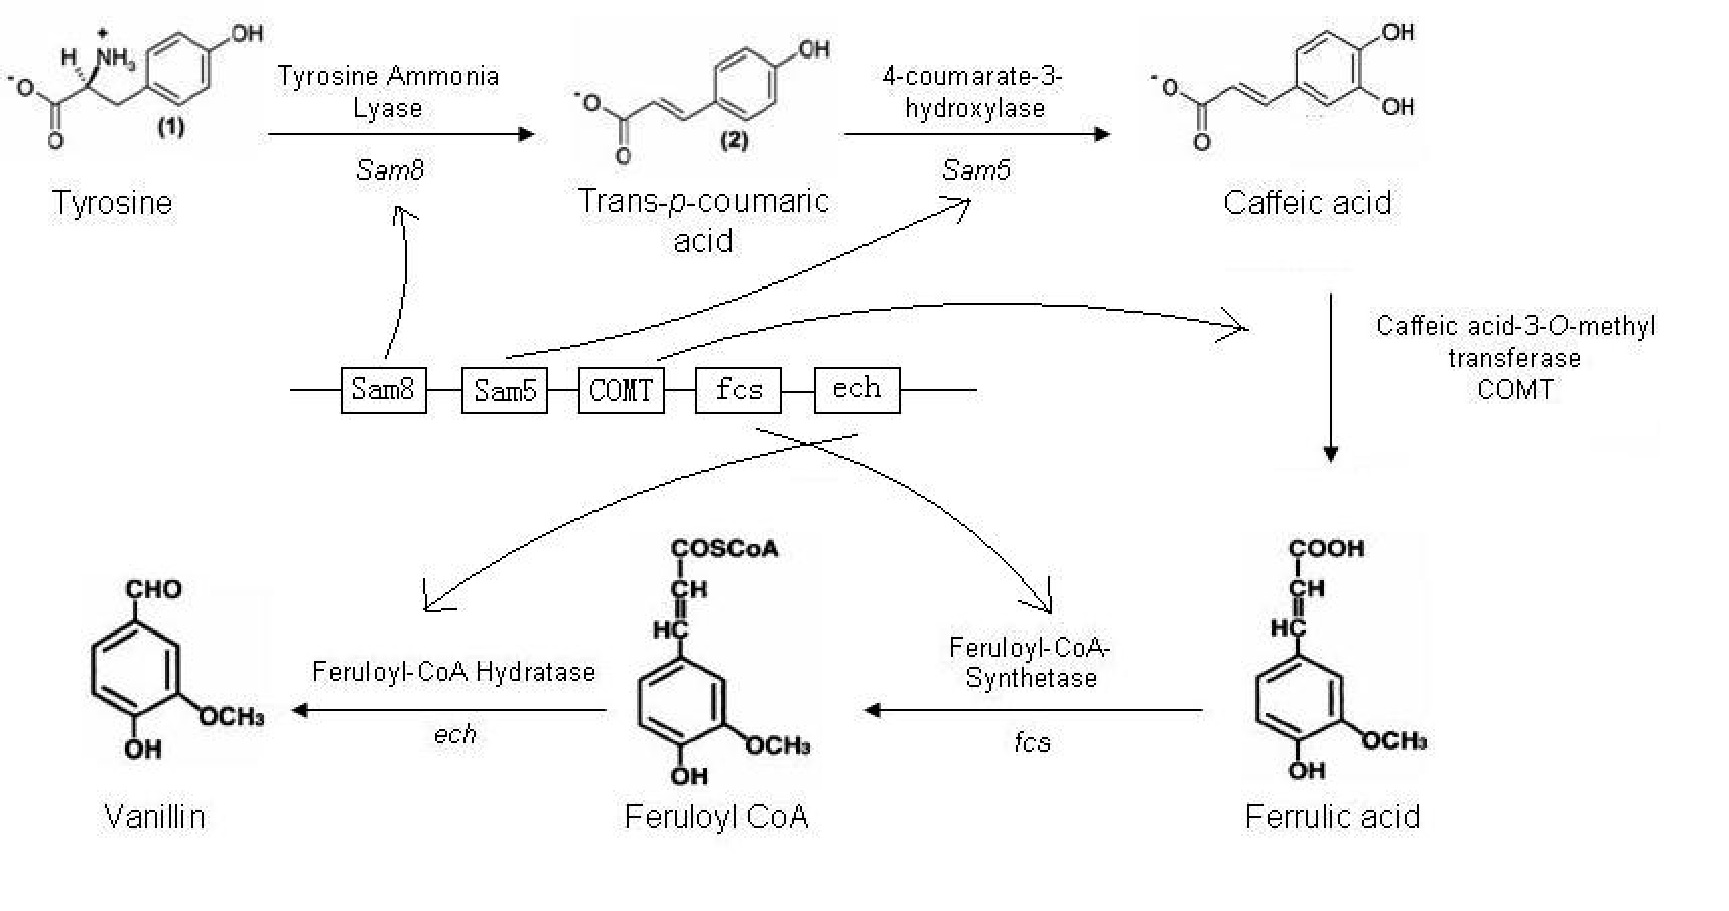
Since it is only a very simple model, we will add some more realistic structures into it. As mentioned before, the process of enzyme expression is also part of the work in wet lab. Although it is shorter than vanillin synthesis, it will affect the pathway definitely. Thus, modeling enzyme expression would be our work in next step (Fig. 3).
Figure3. The vanillin pathway with enzyme expression
Reference: 1. https://2007.igem.org/Edinburgh. Accessed on August 2007.
