Virginia Tech/infect
From 2007.igem.org
|
|
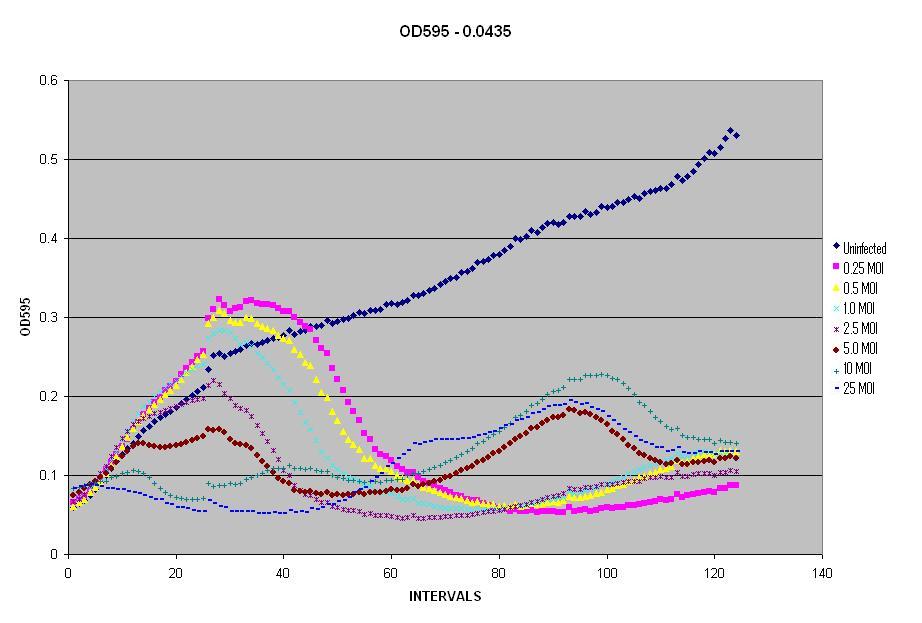
The next scale of our model involved matching infection of E. coli by phage λ.This was simple because we had generated plenty of growth curves of bacteria and had produced numerous phage lysates. All that needed to be done was run the experiment with both bacteria and phage, then interpret the data. We wanted to test the OD595 of LE392 E. coli in the plate reader when the amount of phage is varied. Thus, we began by growing an ON culture of LE392 and converted it from the OD600 of the spectrophotometer to the OD595 of the Plate Reader. We then decided to run the different dilutions of LE392 and the different Multiplicities of Infection (MOI) on one plate. The plate had dilutions of LE392 at OD595s of 0.029, 0.0435, 0.058, and 0.0725. The plates also had MOIs of 0.25, 0.5, 1.0, 2.5, 5.0, 10, and 25 of λ phage. The plate was placed in the reader to read the OD595 every five minutes, while shaking and maintaining a temperature of 37°C, for a total of 125 time intervals. Milli-Q water was added after the first 25 cycles to prevent dehydration and then the plate reader was allowed to run for another 100 cycles overnight. ResultsIn this figure, we started with an Optical Density of 0.0435 and seven MOIs. As you can see, as the MOI increases, the OD decreases more rapidly, but also notice that it begins to come back and rise again. For the second rise in OD, notice that as the MOI increases, so does the OD. The reason for the initial decrease in OD is because the λ phage is taking over the culture and the cells begin to die faster than they are growing. Higher MOIs kill off more cells initially, but they also generate more lysogens than lower MOIs, thus you see a rapid rise in the OD after the initial cells die off.
} |


