Tokyo/Expression level check
From 2007.igem.org
m (→Samples:) |
|||
| Line 8: | Line 8: | ||
Lambda cI-regulated promoter and the lux lac hybrid promoter were tested. | Lambda cI-regulated promoter and the lux lac hybrid promoter were tested. | ||
==== Samples: ==== | ==== Samples: ==== | ||
| - | + | Each sample cells has two plasmids. | |
| - | + | ||
| - | + | *A4Δp([http://partsregistry.org/Part:BBa_I751100 BBa_I751100])/ pc1-GFP ([http://partsregistry.org/Part:BBa_I751311 BBa_I751311]) | |
| + | *A4 hybrid promoter([http://partsregistry.org/Part:BBa_I751101 BBa_I751101])/pBR322TetR (+)AHL | ||
| + | *A4 hybrid promoter([http://partsregistry.org/Part:BBa_I751101 BBa_I751101])/ pBR322TetR (-)AHL | ||
| + | |||
<br>*The promoter pcI sequence was designed to contain OR1, -35, and -10 regions, but not R2 or OR3. | <br>*The promoter pcI sequence was designed to contain OR1, -35, and -10 regions, but not R2 or OR3. | ||
Revision as of 21:14, 26 October 2007
Works top 0.Hybrid promoter 1.Formulation 2.Assay1 3.Simulation 4.Assay2 5.Future works
Activation check by cell-produced AHL Expression level check on promoters + plasmid sets of A and B sides
Expression level check on two different promoters + plasmid sets
Objective:
To measure and compare the activities of two different promoters + plasmid sets by fluorescence of GFP downstream of each promoter. Lambda cI-regulated promoter and the lux lac hybrid promoter were tested.
Samples:
Each sample cells has two plasmids.
- A4Δp(BBa_I751100)/ pc1-GFP (BBa_I751311)
- A4 hybrid promoter(BBa_I751101)/pBR322TetR (+)AHL
- A4 hybrid promoter(BBa_I751101)/ pBR322TetR (-)AHL
*The promoter pcI sequence was designed to contain OR1, -35, and -10 regions, but not R2 or OR3.
Procedure:
AHL assay Standard protocol
Wash
OD and fluorescence were measured 0, 3, and 6 hours after the fresh culture incubation started.
Result & Conclusion:
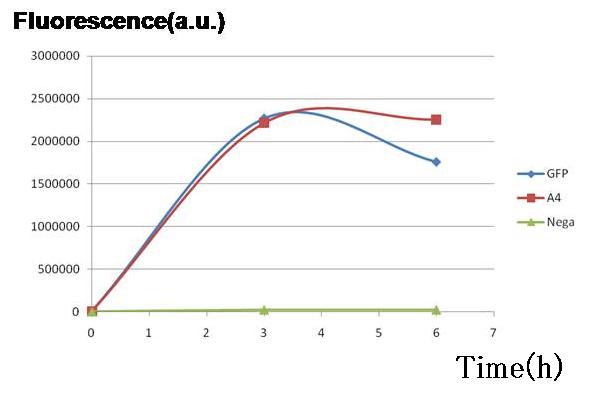
Two plasmid sets, A4Δp+pc1-GFP and A4 hybrid+GFP PBR322TetR (+)AHL, shows almost the same fluorescence of GFP, indicating that expression levels of both sets are almost the same though the latter is a bit smaller.
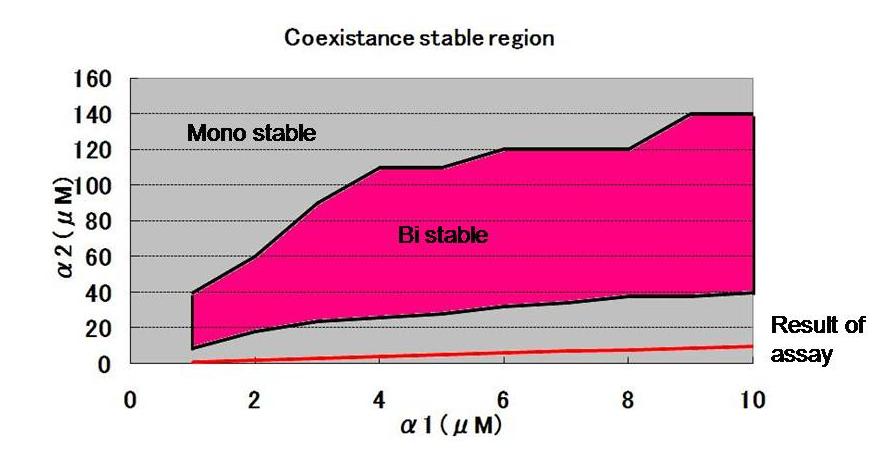
Based on the results, the ranges of bistability and those of mono-stability are calculated as shown in Fig. 1.
.

