Tokyo/Formulation/2.toggle model with hybrid promoter
From 2007.igem.org
(→Step.2 Single cell model with hybrid promoter) |
|||
| (26 intermediate revisions not shown) | |||
| Line 1: | Line 1: | ||
__NOTOC__ | __NOTOC__ | ||
| - | <br>[[Tokyo/Works|Works top]] | + | <br>[[Tokyo/Works|Works top]] 0.[[Tokyo/Works/Hybrid promoter|Hybrid promoter]] '''1.[[Tokyo/Works/Formulation |Formulation]]''' 2.[[Tokyo/Works/Assay |Assay1]] 3.[[Tokyo/Works/Simulation |Simulation]] 4.[[Tokyo/Works/Assay2 |Assay2]] 5.[[Tokyo/Works/Future works |Future works]] |
| - | <br><br>[[Tokyo/Formulation/1.toggle model |Step1]] | + | <br><br>[[Tokyo/Formulation/1.toggle model |Step1]] [[Tokyo/Formulation/2.toggle model with hybrid promoter |Step2]] [[Tokyo/Formulation/3.AHL-experssing model|Step3]] |
<br> | <br> | ||
| Line 17: | Line 17: | ||
<br>[[Image:expression2-4.jpg|250px|none|thumb|Ex2-2]] | <br>[[Image:expression2-4.jpg|250px|none|thumb|Ex2-2]] | ||
| - | <br>Fig 2.2 | + | <br>Fig 2.2 represents the thinking behavior of this system. |
<br>- with low concentration of AHL, the B state becomes unstable. so that the cells at the B state move to the A state which is stable. | <br>- with low concentration of AHL, the B state becomes unstable. so that the cells at the B state move to the A state which is stable. | ||
| - | <br>- with | + | <br>- with high concentration of AHL, both A and B states are stable.The cells at the A state keep the A state and that at the B state keep the B state. |
<br>[[Image:AHLresponse2-2.jpg|300px|none|thumb|Figure 2.2]] | <br>[[Image:AHLresponse2-2.jpg|300px|none|thumb|Figure 2.2]] | ||
| - | <br>The phase plane and the bifurcation are shown in Fig.2.3.A-C and Fig.2.4: | + | <br>The phase plane and the bifurcation diagram are shown in Fig.2.3.A-C and Fig.2.4: |
| + | <br>[[Image:step2-4.JPG|300px|left|thumb|Figure 2.3.A [AHL]=1.0 (a.u.)]][[Image:step2-5.JPG|270px|left|thumb|Figure 2.3.B [AHL]=1.7 (a.u.)]][[Image:step2-6.JPG|300px|none|thumb|Figure 2.3.C [AHL]=15 (a.u.)]] | ||
| + | <br>[[Image:bifurcation_diagram2.JPG|400px|center|thumb|Figure 2.4]] | ||
| + | |||
| + | |||
| + | <!-- | ||
<br>[[Image:AHLresponse2-3.jpg|300px|left|thumb|Figure 2.3.A [AHL]=1.0 (a.u.)]][[Image:AHLresponse2-4.jpg|270px|left|thumb|Figure 2.3.B [AHL]=1.7 (a.u.)]][[Image:AHLresponse2-5.jpg|300px|none|thumb|Figure 2.3.C [AHL]=15 (a.u.)]] | <br>[[Image:AHLresponse2-3.jpg|300px|left|thumb|Figure 2.3.A [AHL]=1.0 (a.u.)]][[Image:AHLresponse2-4.jpg|270px|left|thumb|Figure 2.3.B [AHL]=1.7 (a.u.)]][[Image:AHLresponse2-5.jpg|300px|none|thumb|Figure 2.3.C [AHL]=15 (a.u.)]] | ||
| + | --> | ||
| + | |||
| + | |||
| + | [[Image:step2-1.JPG|200px|left|thumb|Figure 2.5.A]] | ||
| + | [[Image:step2-2.JPG|200px|left|thumb|Figure 2.5.B]] | ||
| + | [[Image:step2-3.JPG|200px|left|thumb|Figure 2.5.C]] | ||
| + | [[Image:step2-7.JPG|200px|none|thumb|Figure 2.5.D]] | ||
<br> | <br> | ||
| + | When the concentration of AHL was low, the stable equilibrium point existed only in A state as shown in Fig.2.3.A. So, the cell at B state moved to A state. Fig.2.3.B and C indicate that as the concentration of AHL increased, the position of the lower nullcline shifted upwards and the number of the stable equilibrium points increased from one to two, so that from monostability to bistability. The change of the number of the equilibrium points was also indicated from the bifurcation diagram in Fig.2.4. | ||
<br> | <br> | ||
| - | <br> | + | <br>Next, we examined the effect of the Hill coefficients. In case of the value of Hill coefficients were N1=3,N2=1,N3=1, the response of the system to the concentration of AHL changed as shown in Fig.2.5.B-D. When the concentration of AHL was low (AHL=1), the cell at B state moved to A state as well as the case of N1=3,N2=1,N3=3 as shown in Fig.2.5.A. However,when the concentration of AHL was middle (AHL≒5), bistable state appeared as shown in Fig.2.5.B. When the concetration AHL was high (AHL≧10), the equilibrium point shifted to B state as shown in Fig.2.5.C and D. Thus, bistable region became extremely narrow differing from the case of N1=3,N2=1,N3=3. |
| + | <br> | ||
| + | <br>As a result of phase plane analysis for the equations, the system was monostable in the case of lower AHL concentration; whereas it was bistable in the case of higher AHL concentration. The values of Hill coefficients were important for the system bistability even in this case. | ||
| + | |||
== == | == == | ||
[[Tokyo/Formulation/2.toggle model with hybrid promoter|Step.2]] >> [[Tokyo/Formulation/3.AHL-experssing_model|Step.3]] | [[Tokyo/Formulation/2.toggle model with hybrid promoter|Step.2]] >> [[Tokyo/Formulation/3.AHL-experssing_model|Step.3]] | ||
Latest revision as of 05:32, 27 October 2007
Works top 0.Hybrid promoter 1.Formulation 2.Assay1 3.Simulation 4.Assay2 5.Future works
Step1 Step2 Step3
Step.2 Single cell model with hybrid promoter
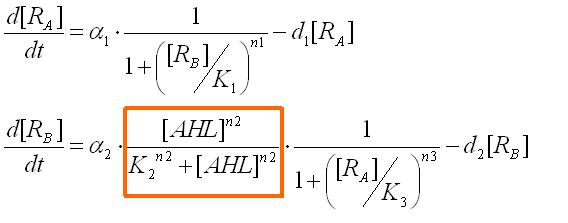
Assuming the system where E. coli does not produce AHL by themselves, we have observed the system's reaction to ab extra AHL. The ODEs were obtained as
where the factor surrounded in the orange box represents the activation of promoter B.
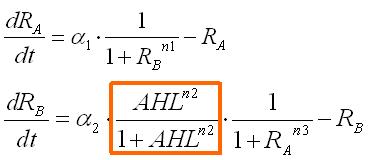
These equations were normalized as follows:
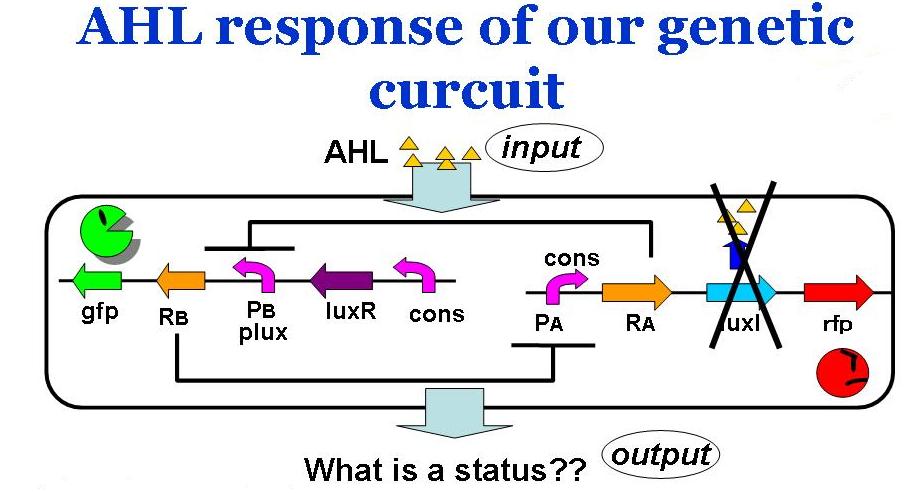
Fig 2.2 represents the thinking behavior of this system.
- with low concentration of AHL, the B state becomes unstable. so that the cells at the B state move to the A state which is stable.
- with high concentration of AHL, both A and B states are stable.The cells at the A state keep the A state and that at the B state keep the B state.
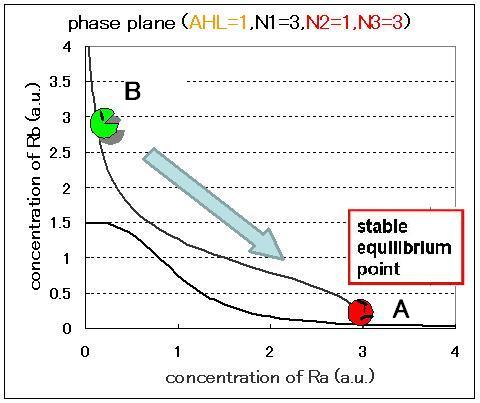
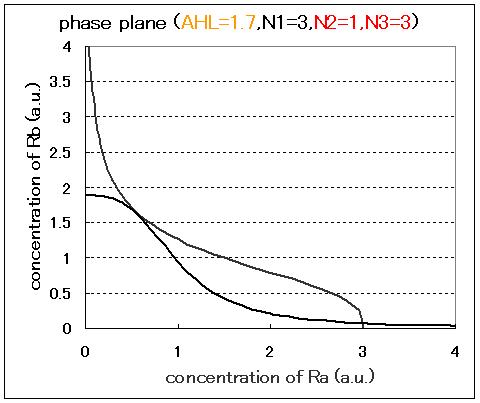
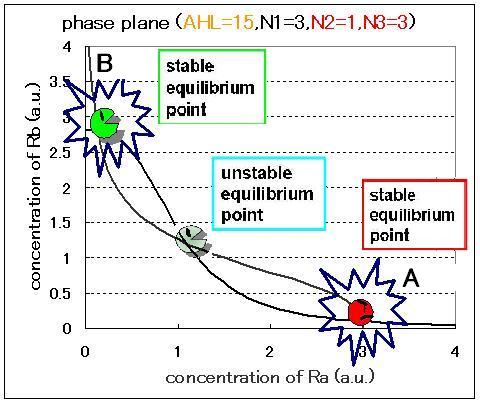
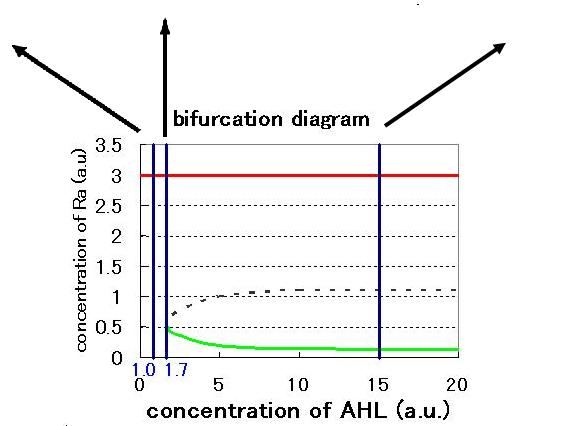
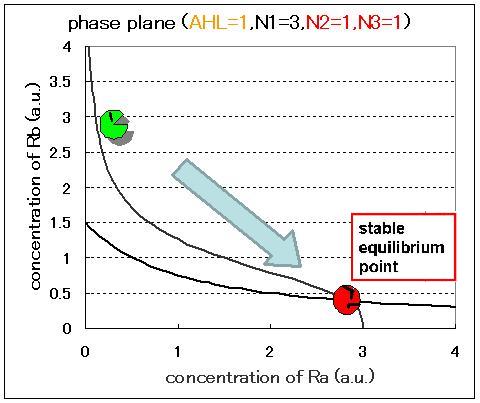
The phase plane and the bifurcation diagram are shown in Fig.2.3.A-C and Fig.2.4:
When the concentration of AHL was low, the stable equilibrium point existed only in A state as shown in Fig.2.3.A. So, the cell at B state moved to A state. Fig.2.3.B and C indicate that as the concentration of AHL increased, the position of the lower nullcline shifted upwards and the number of the stable equilibrium points increased from one to two, so that from monostability to bistability. The change of the number of the equilibrium points was also indicated from the bifurcation diagram in Fig.2.4.
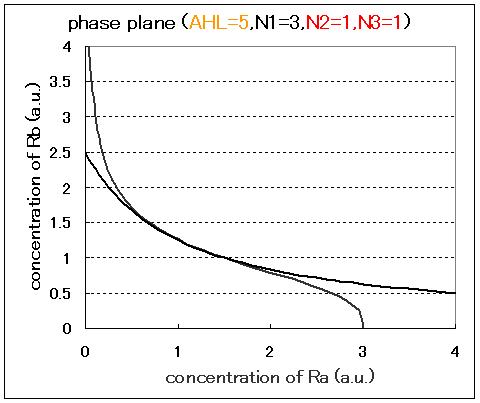
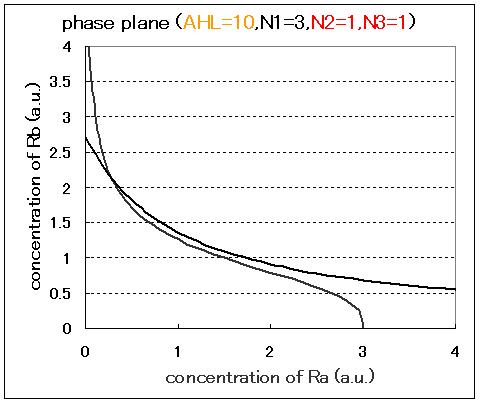
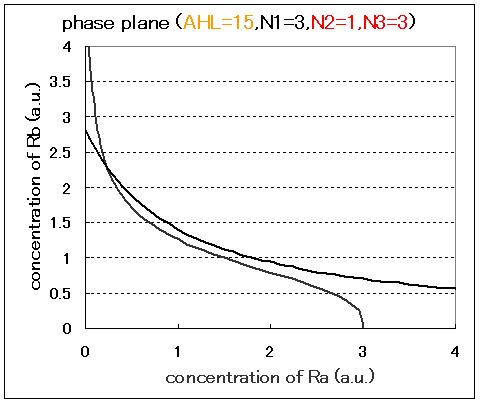
Next, we examined the effect of the Hill coefficients. In case of the value of Hill coefficients were N1=3,N2=1,N3=1, the response of the system to the concentration of AHL changed as shown in Fig.2.5.B-D. When the concentration of AHL was low (AHL=1), the cell at B state moved to A state as well as the case of N1=3,N2=1,N3=3 as shown in Fig.2.5.A. However,when the concentration of AHL was middle (AHL≒5), bistable state appeared as shown in Fig.2.5.B. When the concetration AHL was high (AHL≧10), the equilibrium point shifted to B state as shown in Fig.2.5.C and D. Thus, bistable region became extremely narrow differing from the case of N1=3,N2=1,N3=3.
As a result of phase plane analysis for the equations, the system was monostable in the case of lower AHL concentration; whereas it was bistable in the case of higher AHL concentration. The values of Hill coefficients were important for the system bistability even in this case.
Step.2 >> Step.3
