Tokyo/Formulation/3.AHL-experssing model
From 2007.igem.org
(Difference between revisions)
| Line 1: | Line 1: | ||
__NOTOC__ | __NOTOC__ | ||
| - | <br>[[Tokyo/Works|Works top]] 0.[[Tokyo/Works/Hybrid promoter|Hybrid promoter]] '''1.[[Tokyo/Works/Formulation |Formulation]]''' 2.[[Tokyo/Works/Assay |Assay1]] 3.[[Tokyo/Works/Simulation |Simulation | + | <br>[[Tokyo/Works|Works top]] 0.[[Tokyo/Works/Hybrid promoter|Hybrid promoter]] '''1.[[Tokyo/Works/Formulation |Formulation]]''' 2.[[Tokyo/Works/Assay |Assay1]] 3.[[Tokyo/Works/Simulation |Simulation]] |
| - | <br><br>[[Tokyo/Formulation/1.toggle model |Step1]] [[Tokyo/Formulation/2.toggle model with hybrid promoter |Step2]] [[Tokyo/Formulation/3.AHL-experssing model|Step3]] | + | <br><br>[[Tokyo/Formulation/1.toggle model |Step1]] [[Tokyo/Formulation/2.toggle model with hybrid promoter |Step2]] [[Tokyo/Formulation/3.AHL-experssing model|Step3]] |
<br> | <br> | ||
| + | |||
| + | |||
| + | == Step.3 Single cell model with hybrid promoter and cell-produced AHL == | ||
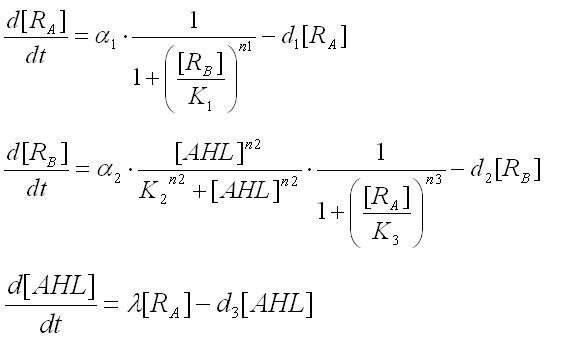
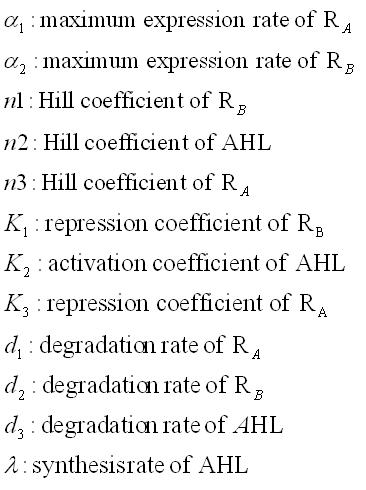
<br>The differential equaitons of the system considering AHL produced by E.coli themselves were given as | <br>The differential equaitons of the system considering AHL produced by E.coli themselves were given as | ||
Revision as of 18:34, 26 October 2007
Works top 0.Hybrid promoter 1.Formulation 2.Assay1 3.Simulation
Step1 Step2 Step3
Step.3 Single cell model with hybrid promoter and cell-produced AHL
The differential equaitons of the system considering AHL produced by E.coli themselves were given as
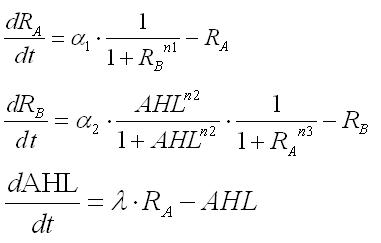
These equations were normalized as follows:
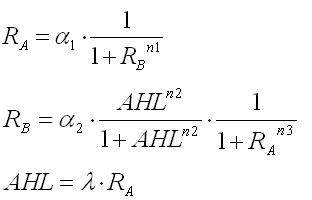
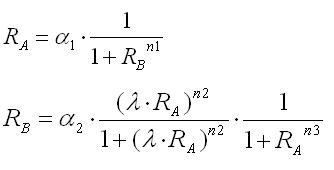
In the steady state,time derivatives are zero.As a result,the nullclines of this system were derived as
By substituting the third equation into the second,the nullclines for Ra and Rb were obtained as
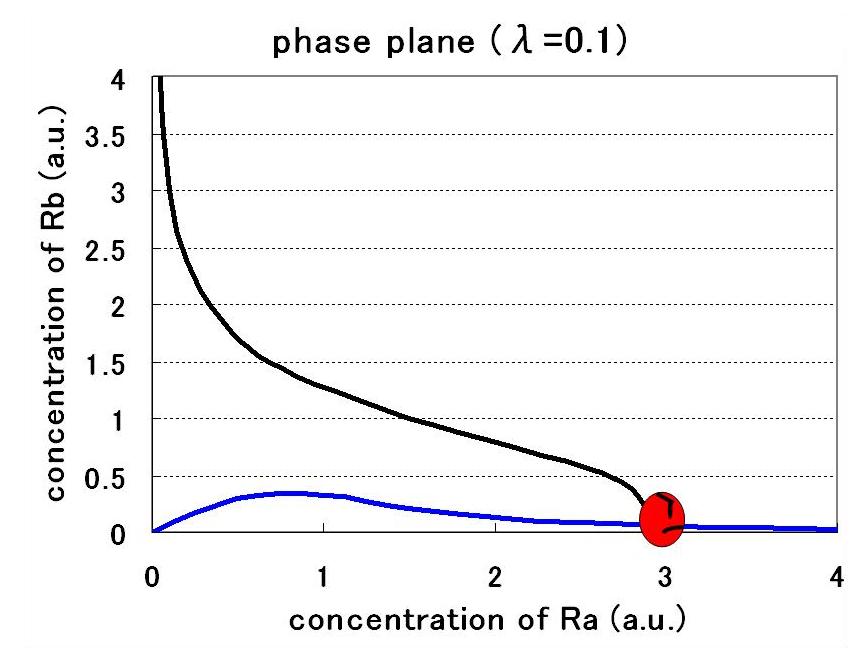
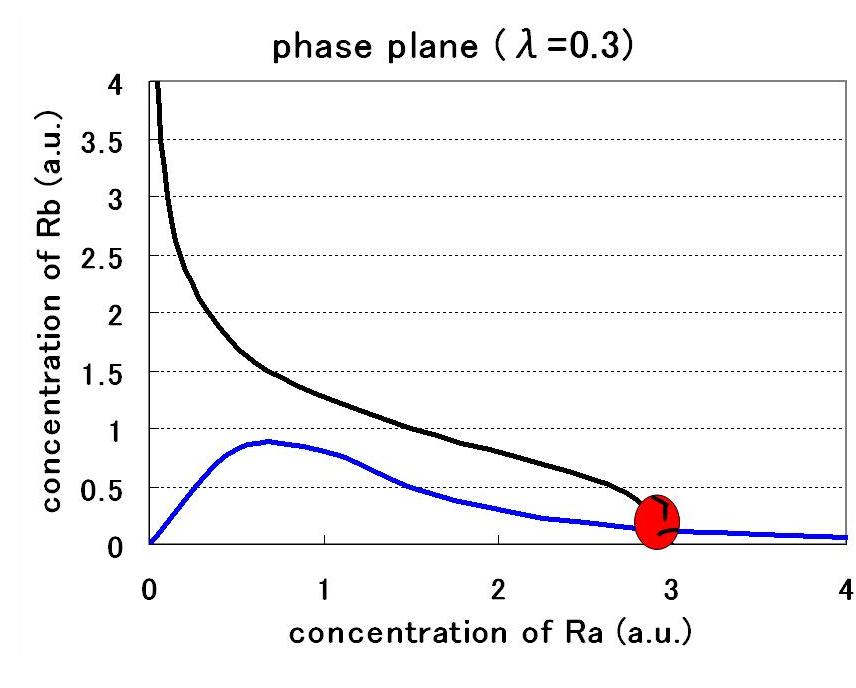
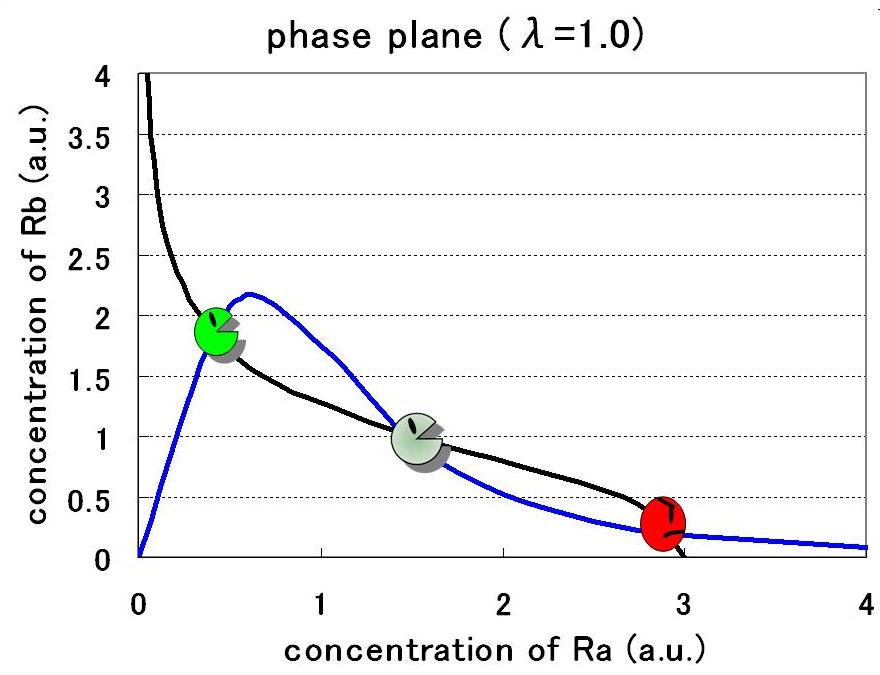
Therefore, the phase plane of this system can be plotted as Fig.3.1.A-C and the number of equilibrium points were decided by the value of the parameters:
Step.3 >> Step.4
