Imperial/Infector Detector/Modelling
From 2007.igem.org

Jaroslaw Karcz. This is very confusing. A modelling page for infector detector and yet there is an entire section devoted to modelling, on the dry-lab drop-down menu. I have been working on ID there. I will continue to do so until I complete the modelling. See link below
Abstract
Graphs/Simulations
Approach
Having generated the models for Infector Detector (applicable to both constructs) we intend to examine the behaviour of the system, w.r.t those state variables, which are experimentally manipulable.
Initially, we examine the behaviour of the system for a given set of parameters. Our immediate goal is to obtain some intuition about the system; data analysis will in due course provide us with more biologically plausible parameters. These can then be incorporated into the system model for a more representative output, which in turn allows for more realistic prediction/investigation. In other words, our initial approach is qualitative.
As described in the section on the development of the model, two models were established. However, these models are intimately connected. In fact, model 1 (link here), which is representative of the infinite energy case, is simply the limit case of the finite energy model, given by model 2. Model 2 approaches model 1, for greatly exaggerated initial energy (E0) and by setting the gene transcription cost, αi to zero.
Simulations are thus performed on the basis of the more representative model 2.
Investigations
The following simulations were performed for both constructs, unless explicitly stated:
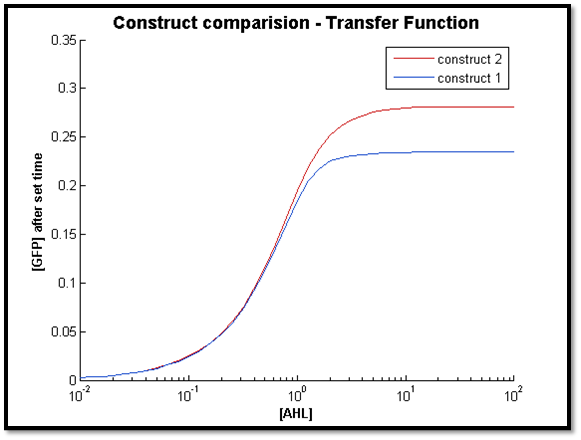
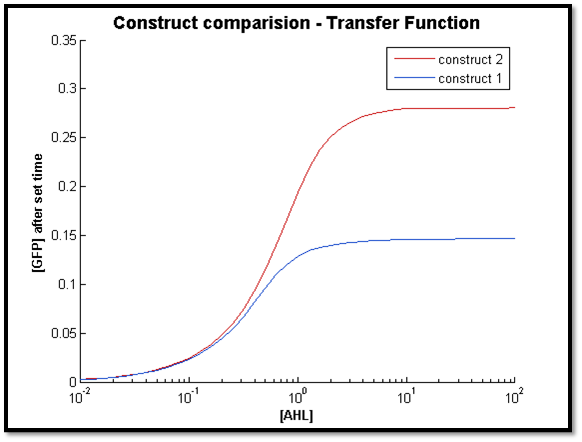
- [GFP] vs [AHL] - transfer function curve
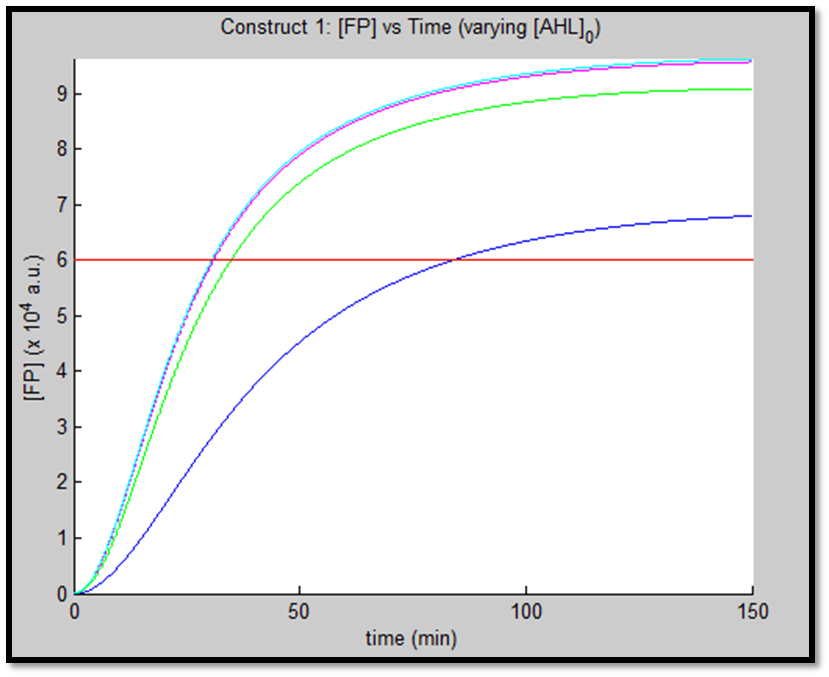
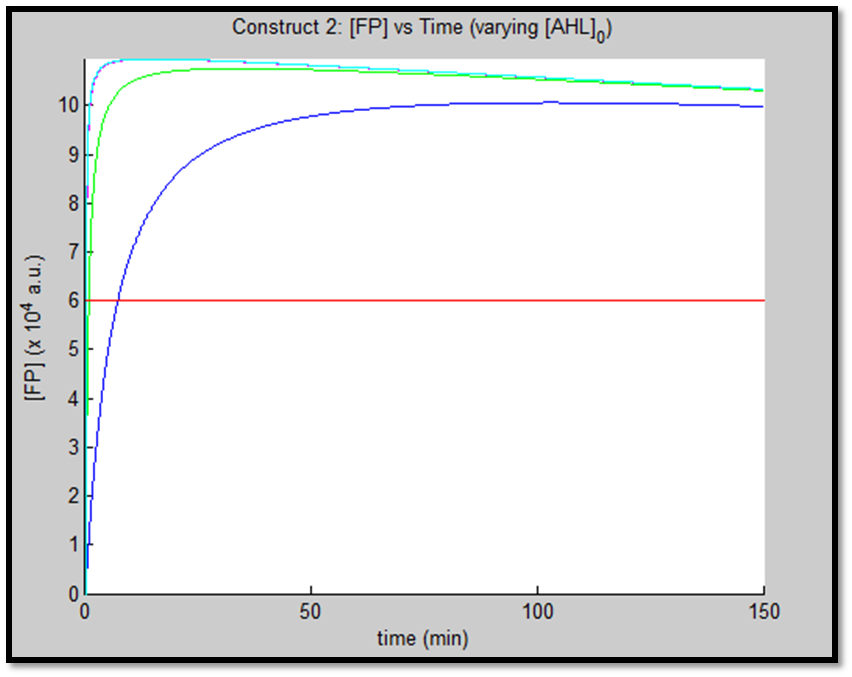
- [GFP] vs time - varying [AHL]0
- [GFP] vs time - varying [P]0
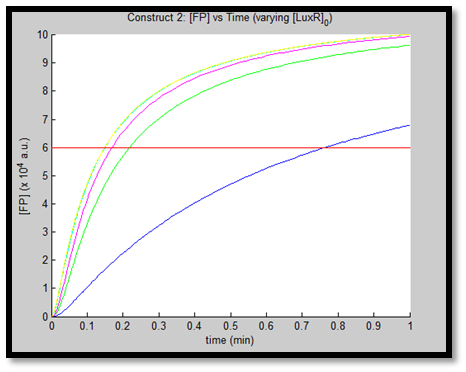
- [GFP] vs time - varying [LuxR]0 - Construct 2
Results
1.
Discussion
2.
Discussion
It is evident from the above figures, that the response time of construct 1 (C1) is far greater than that of construct 2 (C2). C1 crosses some arbitrary threshold at approximately t = 80min, whereas C2 below 10min. This is in line with our hypothesis, as we know steady-state has been forced upon the system in case of construct 2 - by flooding the system with purified LuxR.
Also the peak expression (max output) of GFP obtained for C1 is lower by approximately 50 percent. So, C2 produces a stronger output for corresponding [AHL]. However, although C2 is faster and generates a greater output, its energy consumption is far more pronounced. C1 thus has a greater lifespan.
3.
Discussion
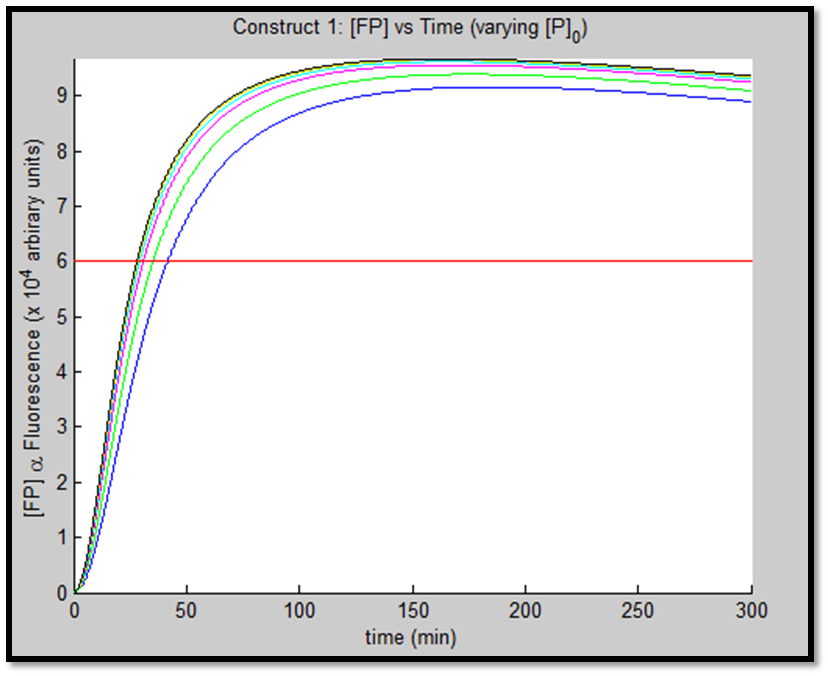
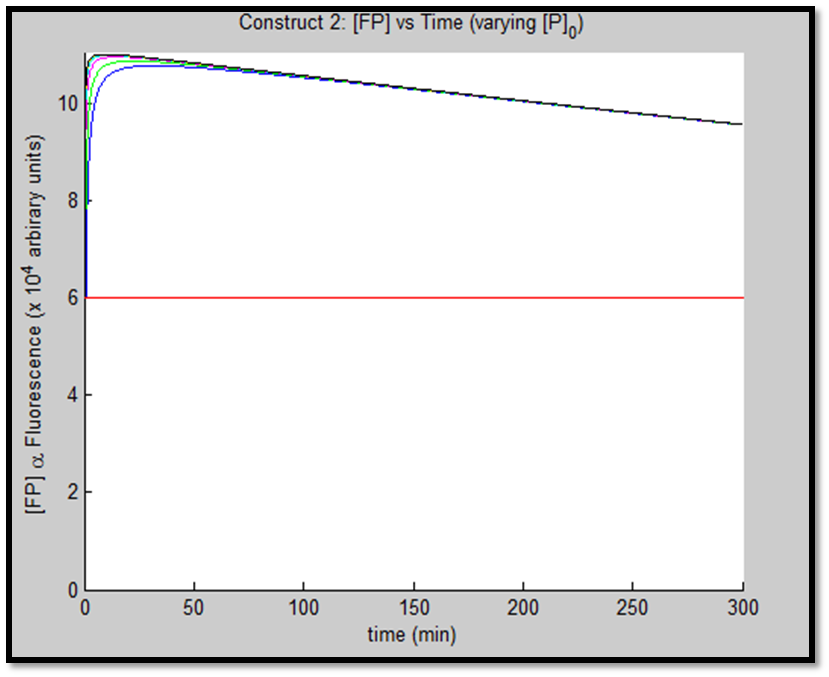
The above figures indicate the effect of increasing initial pLux promoter concentration ([P]0). The experiment involved varying ([P]0) and observing the concomitant effect on GFP expression. The following ([P]0) were utilized: 1, 2, 5, 10, 20 & 50nM.
It is clear that an increase in promoter concentration leads to reduction in response time (meaning that the same threshold is achieved in shorter time = more rapid response). This is a very prominent observation, particularly in the case of construct 1, in fig. x.
The increased promoter concentration also increases eventual maximum output of GFP = greater fluorescence = greater visual output. However, this effect is quite marginal. Evidently, this behaviour levels off (achieves saturation) with increased promoter concentration.
This behaviour is exhibited evidently in both constructs; however, the effect on C2 is quite interesting. Since we are increasing promoter concentration, there is increasing expenditure of energy. From previous analyses, we observed that for [P]0 = 5, saturating behaviour for C2 (when initial [LuxR] was adjusted) occurred at [LuxR] ~ 10nM. For this concentration, the energy expenditure, was quite extensive. So that for the corresponding time lapse, only about a fifth of initial energy content remained. In this experiment, the promoter concentration further depletes that energy, to such an extent that although a high expression peak (of GFP) is obtained (over 100000 arbitrary units), the lack of energy in the system, soon leads to degradation of [GFP] and visual output. For C1, even though the promoter concentration is increased to the same extent, there is still residual energy, and so degradation of signal does not occur on the same time-scale as for C2.
4
Discussion
