Imperial/Infector Detector/Testing
From 2007.igem.org
(Difference between revisions)
m |
m (→Aims of Testing) |
||
| Line 29: | Line 29: | ||
{|align="center" | {|align="center" | ||
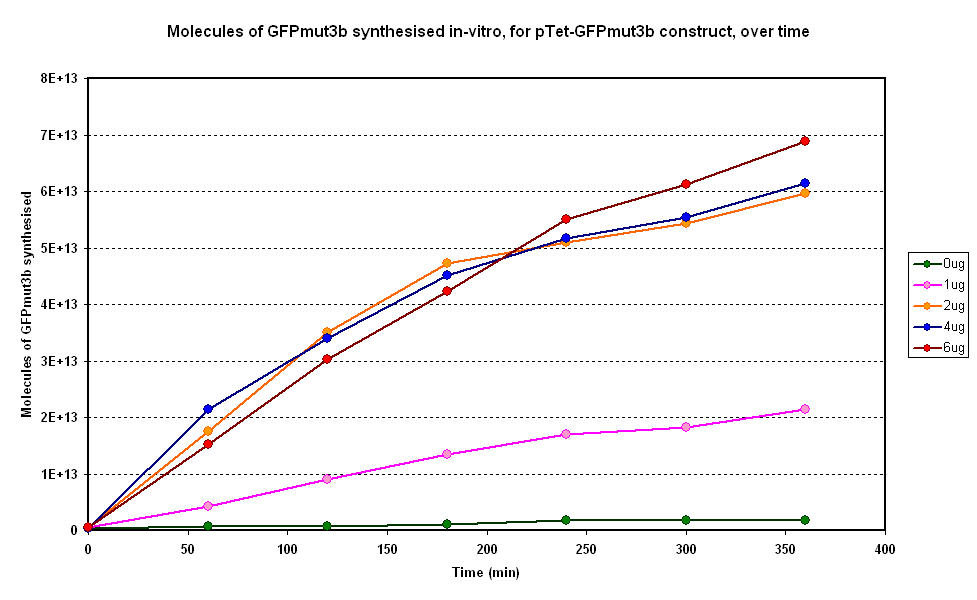
| width="50%"|<br>[[Image:IC 2007 DNA conc CBD.PNG|thumb|300px|Fig.1.1:Molecules of GFPmut3b synthesised over time, for each DNA Concentration ''in vitro'' - The fluorescence was measured over time for each experiment and converted into molecules of GFPmut3b ''in vitro'' using our calibration curve.]] | | width="50%"|<br>[[Image:IC 2007 DNA conc CBD.PNG|thumb|300px|Fig.1.1:Molecules of GFPmut3b synthesised over time, for each DNA Concentration ''in vitro'' - The fluorescence was measured over time for each experiment and converted into molecules of GFPmut3b ''in vitro'' using our calibration curve.]] | ||
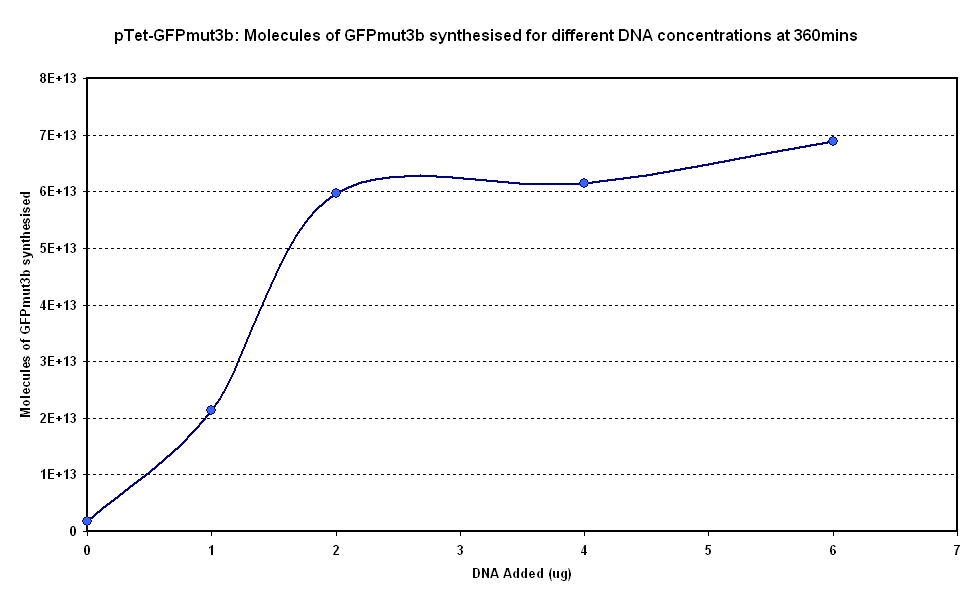
| - | | width="50%"|<br>[[Image:IC 2007 DNA conc @360CBD.PNG|thumb| | + | | width="50%"|<br>[[Image:IC 2007 DNA conc @360CBD.PNG|thumb|375px|Fig.1.2:Molecules of GFPmut3b synthesised for each DNA Concentration ''in vitro'', after 360 minutes]] |
|} | |} | ||
| - | |||
| - | |||
| - | |||
=Results= | =Results= | ||
Revision as of 02:04, 26 October 2007

Infector Detector: Testing
Aims of Testing
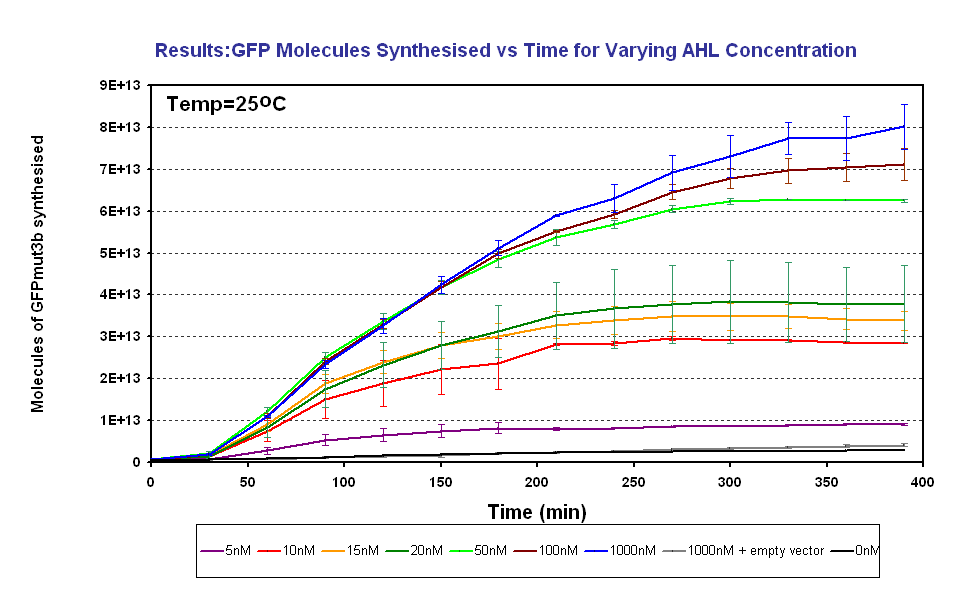
To test and characterise the key characteristics of our system such as the sensitivity of the system to AHL. To do this, we induce the system with known concentrations of AHL input and measure the fluorescence output. Then using a calibration curve the fluorescence was converted into the number of GFPmut3b molecules synthesised, click on the following link for an explaination about how to use calibration curve use the calibration curve].
Results
The results show us the following:
|


