Imperial/Wet Lab/Results/Res1.4
From 2007.igem.org
m |
m |
||
| (6 intermediate revisions not shown) | |||
| Line 1: | Line 1: | ||
| + | <br clear="all"> | ||
| + | |||
{{Template:IC07navmenu}} | {{Template:IC07navmenu}} | ||
__NOTOC__ | __NOTOC__ | ||
| - | + | <br clear="all"> | |
= Degradation Curve: Fluroescence of GFPmut3b as a function of time= | = Degradation Curve: Fluroescence of GFPmut3b as a function of time= | ||
| Line 12: | Line 14: | ||
==Results== | ==Results== | ||
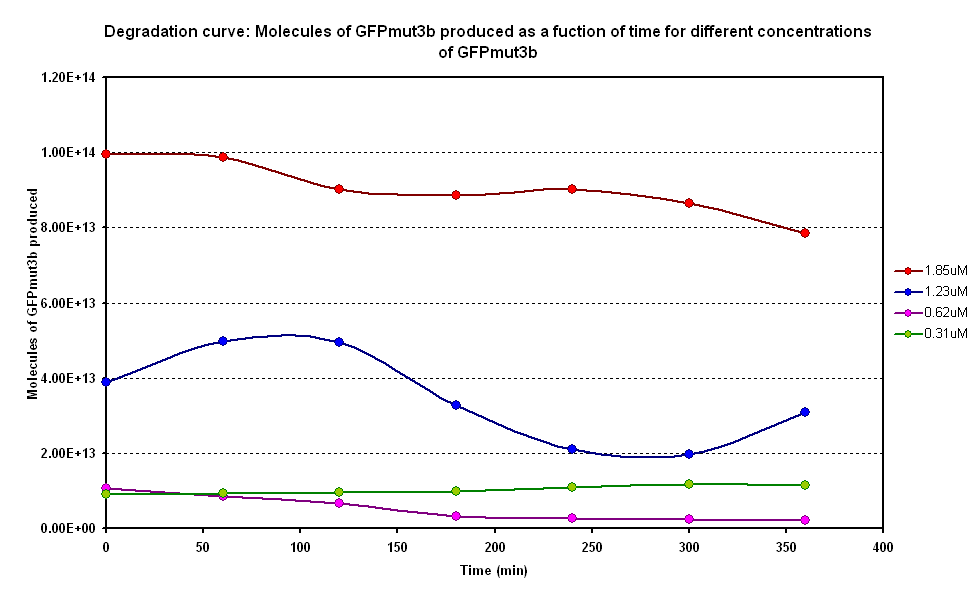
| - | [[Image:IC 2007 Degradation.PNG|left|thumb|400px|Figure 1.1 | + | [[Image:IC 2007 Degradation.PNG|left|thumb|400px|Figure 1.1 Molecules of GFPmut3b produced on average over time]] |
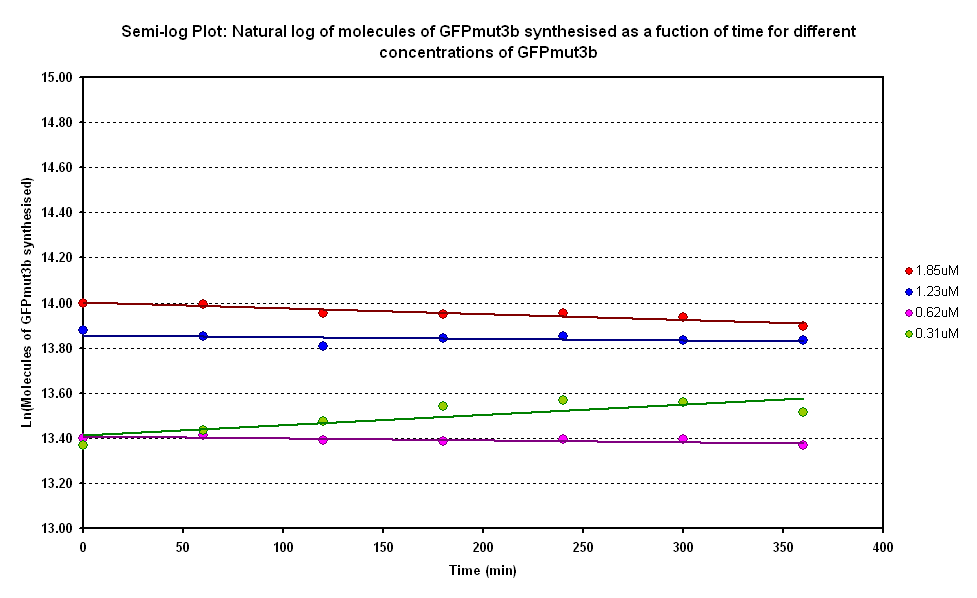
| - | [[Image:IC 2007 Degradation log.png|right|thumb|400px|Figure 1.2 Semi-log plot of | + | [[Image:IC 2007 Degradation log.png|right|thumb|400px|Figure 1.2 Semi-log plot of molecules of GFPmut3b synthesised vs time]] |
<br clear="all"> | <br clear="all"> | ||
| + | |||
| + | '''Raw Data''' | ||
| + | *[[Media:IC_2007_Degradation_curve_25oC_04-10.xls| Raw Data excel file ]] | ||
==Discussion== | ==Discussion== | ||
| - | From Figure 1.1, it can be seen that there is a lot of difference between the degradation of GFPmut3b in the samples. Each sample has a different concentration of GFPmut3b. The | + | From Figure 1.1, it can be seen that there is a lot of difference between the degradation of GFPmut3b in the samples. Each sample has a different concentration of GFPmut3b. The molecules of GFPmut3b synthesised increases and decreases many times for each of the sample averages. This may be due to the experimental errors in the samples like contamination of the samples or air bublbles in them. |
| - | Figure 1.2 is a semi-log graph of log of | + | Figure 1.2 is a semi-log graph of log of molecules of GFPmut3b synthesised against time. This plot allows us to calculate the decay constants for the different GFPmut3b concentrations. |
==Conclusion== | ==Conclusion== | ||
The degradation constant was calculated from the semi-log plot. The average gradients of all the semi-log plots was -0.0003501. This is equivalent to a decay-constant of 0.0003501. Using the equation ln2/k = t<sub>1/2</sub>, the half-life of GFP was calculated to 1980 minutes, or approximately 33 hours. This agrees with the literature value of ~24 hours. So for our experimental timescale of 6 hours, we would only observe 12% of our GFP to be degraded. This supports our assumption that the degradation of GFP is very small within the timescale of our experiments. | The degradation constant was calculated from the semi-log plot. The average gradients of all the semi-log plots was -0.0003501. This is equivalent to a decay-constant of 0.0003501. Using the equation ln2/k = t<sub>1/2</sub>, the half-life of GFP was calculated to 1980 minutes, or approximately 33 hours. This agrees with the literature value of ~24 hours. So for our experimental timescale of 6 hours, we would only observe 12% of our GFP to be degraded. This supports our assumption that the degradation of GFP is very small within the timescale of our experiments. | ||
| - | |||
| - | |||
| - | |||
Latest revision as of 02:06, 27 October 2007

Degradation Curve: Fluroescence of GFPmut3b as a function of time
Aims
To construct a degradation curve of GFPmut3b in the in vitro chassis. This will verify whether the degradation of the system would be a limiting factor to the expression of the system.
Materials and methods
Link to the Protocol
Results
Raw Data
Discussion
From Figure 1.1, it can be seen that there is a lot of difference between the degradation of GFPmut3b in the samples. Each sample has a different concentration of GFPmut3b. The molecules of GFPmut3b synthesised increases and decreases many times for each of the sample averages. This may be due to the experimental errors in the samples like contamination of the samples or air bublbles in them.
Figure 1.2 is a semi-log graph of log of molecules of GFPmut3b synthesised against time. This plot allows us to calculate the decay constants for the different GFPmut3b concentrations.
Conclusion
The degradation constant was calculated from the semi-log plot. The average gradients of all the semi-log plots was -0.0003501. This is equivalent to a decay-constant of 0.0003501. Using the equation ln2/k = t1/2, the half-life of GFP was calculated to 1980 minutes, or approximately 33 hours. This agrees with the literature value of ~24 hours. So for our experimental timescale of 6 hours, we would only observe 12% of our GFP to be degraded. This supports our assumption that the degradation of GFP is very small within the timescale of our experiments.

