Imperial/Wet Lab/Results/CBD1.2
From 2007.igem.org
(→Conclusion) |
(→''In vitro'' GFP expression at 10°C, 37°C and 45°C over a staggered time period) |
||
| (8 intermediate revisions not shown) | |||
| Line 1: | Line 1: | ||
{{Template: IC07navmenu}} | {{Template: IC07navmenu}} | ||
| + | <br clear="all"> | ||
__NOTOC__ | __NOTOC__ | ||
| Line 7: | Line 8: | ||
#*[http://partsregistry.org/Part:BBa_I13522 '''pTet-GFP'''] | #*[http://partsregistry.org/Part:BBa_I13522 '''pTet-GFP'''] | ||
#*[http://partsregistry.org/Part:BBa_E7104 '''pT7-GFP'''] | #*[http://partsregistry.org/Part:BBa_E7104 '''pT7-GFP'''] | ||
| - | #To test the operating range of the constructs at 10°C, 37°C and 45°C | + | #To test the operating range of the constructs at 10°C, 37°C and 45°C. |
#To identify problems in experimental methodology. | #To identify problems in experimental methodology. | ||
| - | Tested on [[Imperial/Wet Lab/Lab Notebook/2007-08-21| 21 08 2007]] | + | Tested on [[Imperial/Wet Lab/Lab Notebook/2007-08-21| 21-08-2007]] |
==Materials and Methods== | ==Materials and Methods== | ||
| Line 34: | Line 35: | ||
| width="300px"|[[Image:IC2007 ExperimentalDesign Phase1 PTet vitro 10degrees.PNG|thumb|300px|Fig.3: GFP Expression of pTet-GFP ''in vitro'' at 10°C over 4 hours]] | | width="300px"|[[Image:IC2007 ExperimentalDesign Phase1 PTet vitro 10degrees.PNG|thumb|300px|Fig.3: GFP Expression of pTet-GFP ''in vitro'' at 10°C over 4 hours]] | ||
| width="50px"| | | width="50px"| | ||
| - | |width="400px"| There appears to be no significant increase in | + | |width="400px"| There appears to be no significant increase in fluorescence levels of the pTet construct over the measured time course. Also shown in Fig.3 is a decrease in fluorescence levels across all samples and controls. Experiment was not continued over required time course due to lab and safety constraints. |
|} | |} | ||
<br clear="all"> | <br clear="all"> | ||
| Line 44: | Line 45: | ||
| width="200px"|[[Image:IC2007 Experimental Design PTet vitro 45degrees-4hours.PNG|thumb|300px|Fig.4: GFP Expression of pTet-GFP ''in vitro'' at 45°C over 4 hours]] | | width="200px"|[[Image:IC2007 Experimental Design PTet vitro 45degrees-4hours.PNG|thumb|300px|Fig.4: GFP Expression of pTet-GFP ''in vitro'' at 45°C over 4 hours]] | ||
| width="50px"| | | width="50px"| | ||
| - | |width="400px"| There appears to be no significant increase in | + | |width="400px"| There appears to be no significant increase in fluorescence levels of the pTet construct over the measured time course. Also shown in Fig.4 is a decrease in fluorescence levels across all samples and controls. Experiment was not continued over required time course due to lab and safety constraints. |
|} | |} | ||
<br clear="all"> | <br clear="all"> | ||
| - | |||
| - | |||
| - | |||
| - | |||
===[http://partsregistry.org/Part:BBa_E7104 '''pT7-GFP'''] (100ng/μl)=== | ===[http://partsregistry.org/Part:BBa_E7104 '''pT7-GFP'''] (100ng/μl)=== | ||
| Line 59: | Line 56: | ||
| width="200px"|[[Image:Ic2007_Experimental_Design_Phase1_protocol_2-1-pT7_vitro.PNG|thumb|300px|Fig.5: GFP Expression of pTet-GFP ''in vitro'']] | | width="200px"|[[Image:Ic2007_Experimental_Design_Phase1_protocol_2-1-pT7_vitro.PNG|thumb|300px|Fig.5: GFP Expression of pTet-GFP ''in vitro'']] | ||
| width="50px"| | | width="50px"| | ||
| - | |width="400px"|There appears to be no significant increase in | + | |width="400px"|There appears to be no significant increase in fluorescence levels of the pT7 construct over the measured time course. Also shown in Fig.5 there is a decrease in fluorescence levels across all samples and controls. Experiment was not continued over required time course due to lab and safety constraints. |
|} | |} | ||
<br clear="all"> | <br clear="all"> | ||
| Line 67: | Line 64: | ||
*Negative control - S30 cell extract of equal volume | *Negative control - S30 cell extract of equal volume | ||
| + | [[Media:IC_2007_PT7_in_vitro_37oC.xls|Complete set of results and raw data ]] | ||
<br clear="all"> | <br clear="all"> | ||
| Line 77: | Line 75: | ||
====''In vitro'' GFP expression at 10°C, 37°C and 45°C over a staggered time period==== | ====''In vitro'' GFP expression at 10°C, 37°C and 45°C over a staggered time period==== | ||
| - | Due to lab and safety constraints, a staggered time period cannot be obtained for GFP expression at 10°C 45°C temperatures. The results from both these experiments (Fig.3,4) also do not indicate much expression at these temperatures. In comparison, it was observed that the fluorescence levels of the positive control at 45°C decreased more quickly than that in the 10°C one. This may be due to protein instability at higher temperatures. Nevertheless, these results are not conclusive of whether the decay is | + | Due to lab and safety constraints, a staggered time period cannot be obtained for GFP expression at 10°C and 45°C temperatures. The results from both these experiments (Fig.3,4) also do not indicate much expression at these temperatures. In comparison, it was observed that the fluorescence levels of the positive control at 45°C decreased more quickly than that in the 10°C one. This may be due to protein instability at higher temperatures. Nevertheless, these results are not conclusive of whether the decay is proportional or exponential. |
Similar patterns of fluorescence level curves from samples and controls in Fig.2 suggests that there may be some major issues in our experimental methodology that require further investigation. It is postulated that evaporation could play a major role in the inconsistency that we have observed. Reducing evaporation to ensure consistent volume of the reaction mixture is ideal to ensure a singular variable in the experiment. Other factors also include the different batches of S30 cell extracts used, the different method of maintaining temperature (water baths and incubators), DNA concentration, and variability in the fluorometer instrument. | Similar patterns of fluorescence level curves from samples and controls in Fig.2 suggests that there may be some major issues in our experimental methodology that require further investigation. It is postulated that evaporation could play a major role in the inconsistency that we have observed. Reducing evaporation to ensure consistent volume of the reaction mixture is ideal to ensure a singular variable in the experiment. Other factors also include the different batches of S30 cell extracts used, the different method of maintaining temperature (water baths and incubators), DNA concentration, and variability in the fluorometer instrument. | ||
| Line 98: | Line 96: | ||
* pTet-GFP construct works ''in vitro''. | * pTet-GFP construct works ''in vitro''. | ||
* Major factors in our experimental methodology (eg. DNA concentration, evaporation, staggered) might account for the non-correlative fluorescence levels, as with the observed pattern of all curves across the time periods. | * Major factors in our experimental methodology (eg. DNA concentration, evaporation, staggered) might account for the non-correlative fluorescence levels, as with the observed pattern of all curves across the time periods. | ||
| - | |||
| - | |||
| - | |||
Latest revision as of 02:30, 27 October 2007

In vitro Testing of pTet-GFP and pT7-GFP Constructs
Aims
- To determine if the following constructs work in vitro:
- [http://partsregistry.org/Part:BBa_I13522 pTet-GFP]
- [http://partsregistry.org/Part:BBa_E7104 pT7-GFP]
- To test the operating range of the constructs at 10°C, 37°C and 45°C.
- To identify problems in experimental methodology.
Tested on 21-08-2007
Materials and Methods
Link to the Protocol
Results
[http://partsregistry.org/Part:BBa_I13522 pTet-GFP] (100ng/μl)
Test: 21-08-2007
In vitro testing at 37°C
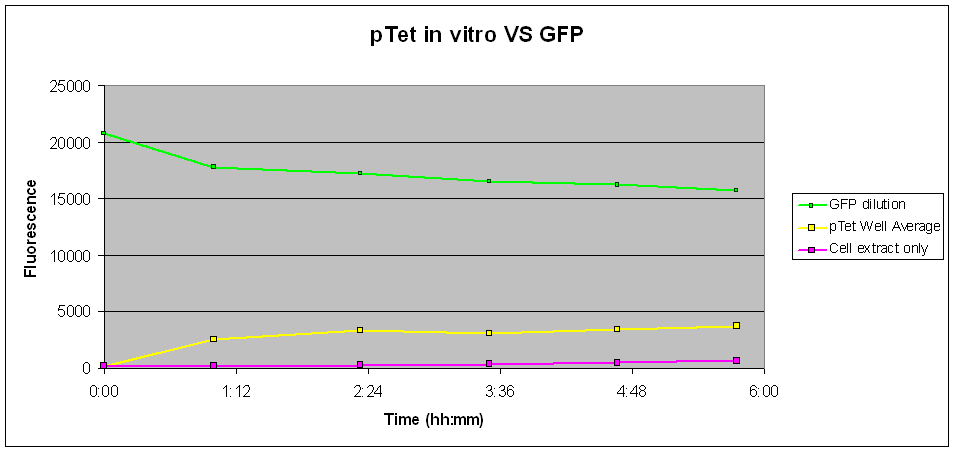
| The pTet-GFP contruct was tested in vitro using commercial S30 Cell Extract at 37 °C. As shown in Fig.1, pTet showed a marked increase in the first hour before levelling, reaching a slow but steady increase throughout a period of 4 hours. |
Test: 22-08-2007
pTet-GFP in vitro expression at 10°C
| There appears to be no significant increase in fluorescence levels of the pTet construct over the measured time course. Also shown in Fig.3 is a decrease in fluorescence levels across all samples and controls. Experiment was not continued over required time course due to lab and safety constraints. |
Test: 22-08-2007
pTet-GFP in vitro GFP expression at 45°C
| There appears to be no significant increase in fluorescence levels of the pTet construct over the measured time course. Also shown in Fig.4 is a decrease in fluorescence levels across all samples and controls. Experiment was not continued over required time course due to lab and safety constraints. |
[http://partsregistry.org/Part:BBa_E7104 pT7-GFP] (100ng/μl)
Test: 21-08-2007 to 22-08-2007
In vitro testing at 37°C
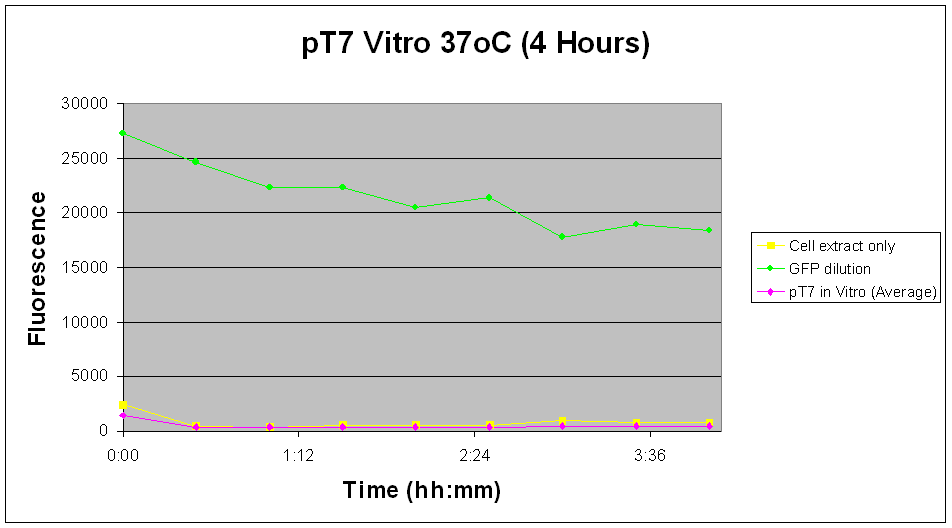
| There appears to be no significant increase in fluorescence levels of the pT7 construct over the measured time course. Also shown in Fig.5 there is a decrease in fluorescence levels across all samples and controls. Experiment was not continued over required time course due to lab and safety constraints. |
Controls:
- Positive control - diluted GFP solution of equal volume
- Negative control - S30 cell extract of equal volume
Complete set of results and raw data
Discussion
[http://partsregistry.org/Part:BBa_I13522 pTet-GFP]
In vitro testing at 37°C
Fig.1 indicates that there was a fair amount of expression of GFP with the pTet-GFP construct, leading to an increase in fluoresence over time. Although the level of expression is starkly reduced as compared to those in vivo, the construct is shown to be consistently working well in vitro.
In vitro GFP expression at 10°C, 37°C and 45°C over a staggered time period
Due to lab and safety constraints, a staggered time period cannot be obtained for GFP expression at 10°C and 45°C temperatures. The results from both these experiments (Fig.3,4) also do not indicate much expression at these temperatures. In comparison, it was observed that the fluorescence levels of the positive control at 45°C decreased more quickly than that in the 10°C one. This may be due to protein instability at higher temperatures. Nevertheless, these results are not conclusive of whether the decay is proportional or exponential.
Similar patterns of fluorescence level curves from samples and controls in Fig.2 suggests that there may be some major issues in our experimental methodology that require further investigation. It is postulated that evaporation could play a major role in the inconsistency that we have observed. Reducing evaporation to ensure consistent volume of the reaction mixture is ideal to ensure a singular variable in the experiment. Other factors also include the different batches of S30 cell extracts used, the different method of maintaining temperature (water baths and incubators), DNA concentration, and variability in the fluorometer instrument.
Although the initial data corresponds well with previous 37°C in vivo experiments, the absence of a contiguous time course means that it is not feasible to extrapolate the data given the vast difference in fluorescence levels over the three stages.
[http://partsregistry.org/Part:BBa_E7104 pT7-GFP]
In vitro testing at 37°C
Likewise with the in vivo tests, the pT7-GFP construct did not give the expected increase in fluorescence levels over time. Although this can be attributed to the further reduction in fluorescent signals due to lower expression in the in vitro chassis, it seems more likely that the problem lies more with the construct than other factors.
In vitro GFP expression at 37°C over a staggered time period
Fig.5 indicates a minimal increase in fluorescence levels over a 29 hour period, suggesting that not enough GFP has been expressed for a significant change in fluorescent readings. Although the uncertainty of the results as described above is applicable to this experiment as such, just by judging from the relative total fluorescence alone would indicate that pTet-GFP construct is a more viable option to our design.
Conclusion
- pTet-GFP construct consistently gives higher levels of fluorescence than pT7-GFP construct and should be preferred.
- pTet-GFP construct works in vitro.
- Major factors in our experimental methodology (eg. DNA concentration, evaporation, staggered) might account for the non-correlative fluorescence levels, as with the observed pattern of all curves across the time periods.


