Imperial/Infector Detector/Testing
From 2007.igem.org
m |
|||
| (83 intermediate revisions not shown) | |||
| Line 1: | Line 1: | ||
{{Template:IC07navmenu}} | {{Template:IC07navmenu}} | ||
| + | <br clear="all"> | ||
<html> | <html> | ||
<link rel="stylesheet" href="/igem07/index.php?title=User:Dirkvs/Stylesheets/IC07persist.css&action=raw&ctype=text/css" type="text/css" /> | <link rel="stylesheet" href="/igem07/index.php?title=User:Dirkvs/Stylesheets/IC07persist.css&action=raw&ctype=text/css" type="text/css" /> | ||
| Line 12: | Line 13: | ||
<li><a href="https://2007.igem.org/Imperial/Infector_Detector/Implementation" title=""><span>Implementation</span></a></li> | <li><a href="https://2007.igem.org/Imperial/Infector_Detector/Implementation" title=""><span>Implementation</span></a></li> | ||
<li><a class="current" href="https://2007.igem.org/Imperial/Infector_Detector/Testing" title=""><span>Testing</span></a></li> | <li><a class="current" href="https://2007.igem.org/Imperial/Infector_Detector/Testing" title=""><span>Testing</span></a></li> | ||
| + | <li><a href="https://2007.igem.org/Imperial/Infector_Detector/F2620 Comparison" title=""><span>F2620</span></a></li> | ||
<li><a href="https://2007.igem.org/Imperial/Infector_Detector/Conclusion" title=""><span>Conclusion</span></a></li> | <li><a href="https://2007.igem.org/Imperial/Infector_Detector/Conclusion" title=""><span>Conclusion</span></a></li> | ||
</ul> | </ul> | ||
| Line 20: | Line 22: | ||
__NOTOC__ | __NOTOC__ | ||
= Infector Detector: Testing = | = Infector Detector: Testing = | ||
| + | ==Summary== | ||
| + | The key results of the testing were: | ||
| + | *The optimum DNA concentration for [http://partsregistry.org/Part:BBa_T9002 '''pTet-LuxR-pLux-GFPmut3b'''] in our Commcercial S30 Cell extract is 4µg. | ||
| + | *Several of the specifications have been tested and met: | ||
| + | **'''Input''':Sensitivity to 5-50nM AHL | ||
| + | **'''Operating Conditions''':25<sup>o</sup>C | ||
| + | **'''Response Time''':Response time to of visual threshold not determined, but peak fluorescence is reached at ~300 minutes. | ||
| - | == Aims | + | == Aims== |
| - | To test and | + | From the initial testing we determined that the construct worked in both ''in vivo'' and ''in vitro''. Now we were concerned with: |
| + | *'''Optimization''' - To test and obtain the '''optimal DNA concentration for construct 1 ''in vitro'' to reach the full potential of our infecter detector system. | ||
| + | *'''Test our specifications''' - To test the range 5-50nM AHL defined in our specifications and characterise the '''output of GFPmut3b for a range of AHL inputs'''. We aimed to measure fluorescence and using our calibration curve convert to molecules of GFPmut3b, click here for our [[Imperial/Wet_Lab/Results/Res1.3 |calibration curve]] and for how we [[Imperial/Wet Lab/Results/Res1.3/Converting_Units| used it to convert]] | ||
| - | =Results= | + | ==Results== |
| - | {|align="left" | + | ===DNA Concentrations=== |
| - | |< | + | <br clear=all> |
| + | {|align="center" style="text-align: center; border-top:1px solid #000077; border-right:1px solid #000077; border-bottom:1px solid #000077; border-left:1px solid #000077;" | ||
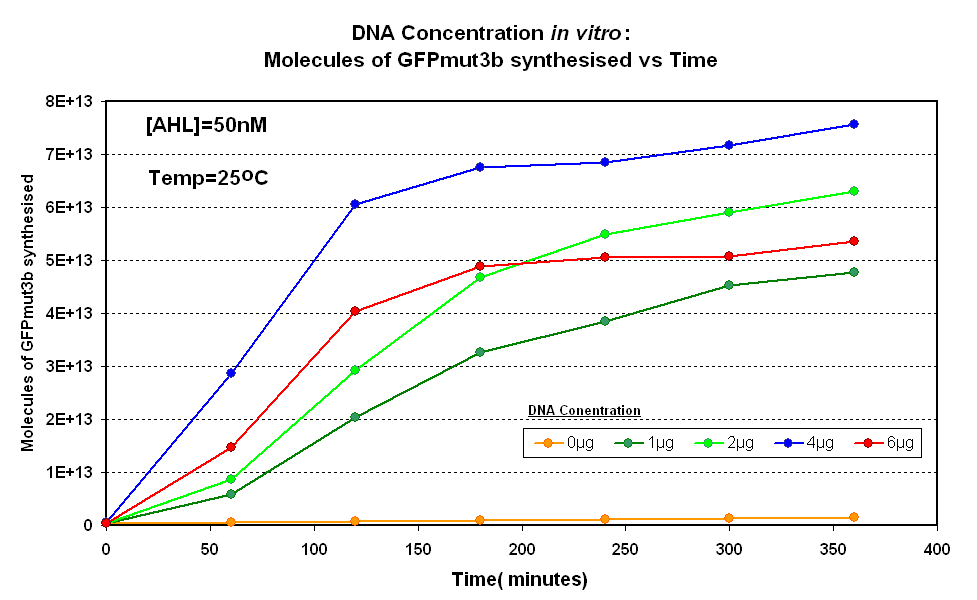
| + | |<br><center>[[Image:IC 2007 DNA Concentration.PNG|thumb|420px|left|Fig.1.1:Molecules of GFPmut3b synthesised over time, for each DNA Concentration ''in vitro'' at 25<sup>o</sup>C - The fluorescence was measured over time for each experiment and converted into molecules of GFPmut3b ''in vitro'' | ||
| + | [[Imperial/Wet Lab/Results/Res1.3/Converting_Units| using our calibration curve]] Click here for [[Imperial/Wet_Lab/Results/ID2.1| results]] and [[Imperial/Wet_Lab/Protocols/ID2.1| protocol]].]] | ||
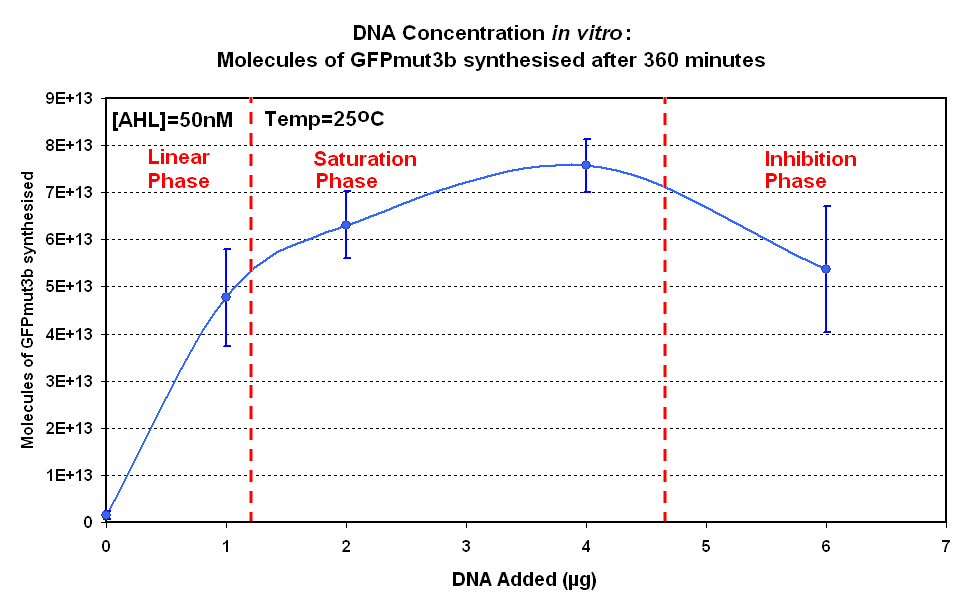
| + | [[image:IC 2007 DNA Concentration 360mins.PNG|thumb|420px|right|Fig.1.2:Molecules of GFPmut3b synthesised for each DNA Concentration ''in vitro'', after 360 minutes at 25<sup>o</sup>C.<br><br><br>]] </center> | ||
|- | |- | ||
| - | |The results show us the following: | + | |style="text-align: left;" |<br>The Results above show that the optimum DNA concentration for ''in vitro'' is 4µg for 50nM AHL. From figure 1.1. and 1.2 it can be seen that as DNA concentration increases above 4µg the GFPmut3b molecules synthesised decrease. Interestingly for figure 1.2 the graph can be split into several regions of how the DNA concentration changes the output of GFPmut3b synthesis: |
| + | *'''Linear phase''' - The DNA Concentration is proportional to synthesis of GFP molecules | ||
| + | *'''Saturation phase''' - The expressional machinary is saturated i.e. RNA polymerases and ribosomes, and so the synthesis is no longer affected by DNA concentration. The maximum synthesis of GFP is at 4µg. | ||
| + | *'''Inhibition phase'''- Increasing the DNA concentration actually inhibits the rate of protein synthesis. | ||
| + | The fact that increasing DNA concentration above 4µg causes a decrease in rate of protein synthesis is very interesting. The reason for this is thought to be that increasing DNA concentration causes problems with premature translational termination. <br> | ||
| + | <br> | ||
| + | Although there is only a limited number of data points and there is a lot of error we feel that the results do show that 4µg was taken as the maximum and used for the rest of the testing. This agrees with the instructions provided by Promega which state that above 4µg the rate of protein synthesis is inhibited. | ||
| + | |} | ||
| + | <br clear=all><br> | ||
| + | |||
| + | ===AHL Testing=== | ||
| + | <br clear=all> | ||
| + | {|align="center" style="text-align: center; border-top:1px solid #000077; border-right:1px solid #000077; border-bottom:1px solid #000077; border-left:1px solid #000077;" | ||
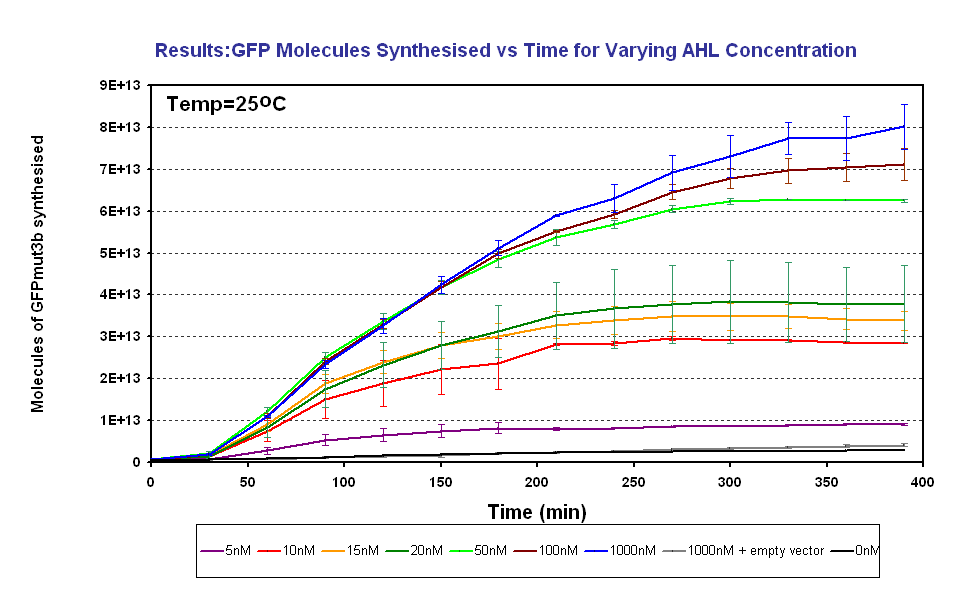
| + | |<br><center>[[Image:GFPMolecule syn ID2 Final.PNG|thumb|center|420px|left|Fig.1.3: Molcules of GFPmut3b synthesised vs AHL concentrations at 25<sup>o</sup>C. The Testing was carried out for the 4µg of DNA. Again the fluorescence reading was converted into GFPmut3b molecules via the calibration curve. Click for full results and protocols can be found on the links [[Imperial/Wet Lab/Results/ID3.1| results]] and [[Imperial/Wet_Lab/Protocols/ID3.1|protocol]] pages.]] | ||
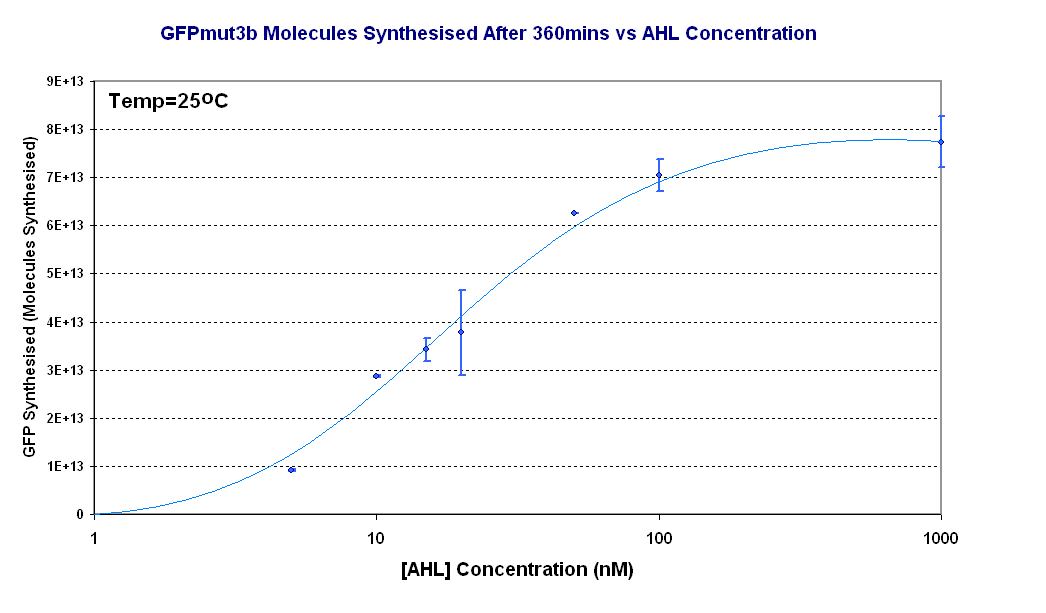
| + | [[Image:Titrations curve - molecules.PNG|thumb|440px|right|Fig.1.4:Molecules of GFPmut3b synthesised for each DNA Concentration ''in vitro'', after 360 minutes at 25<sup>o</sup>C. The data is from the fluorescence measurement at 360minutes which was converted to GFPmut3b molecules and plotted against [AHL]. The scale on the X axis is a logarithmic scale.]]</center> | ||
| + | |- | ||
| + | |style="text-align: left;" |<br> | ||
| + | Figure 1.3 shows us the following: | ||
| + | *Functional at 25<sup>o</sup>C | ||
*The output of '''GFPmut3b increases with input of AHL''' | *The output of '''GFPmut3b increases with input of AHL''' | ||
*The system is sensitive to a range of '''5-1000nM AHL''' | *The system is sensitive to a range of '''5-1000nM AHL''' | ||
| - | *The GFPmut3b molecules synthesis stops at '''~300minutes'''. This could be due to steady state or due to no synthesis of GFPmut3b. It is known not to be steady state because the degradation experiment | + | *The GFPmut3b molecules synthesis stops at '''~300minutes'''. This could be due to steady state or due to no synthesis of GFPmut3b. It is known not to be steady state because the [[Imperial/Wet_Lab/Results/Res1.4| degradation experiment]] proved degradation is negligible. Interestingly this time at which synthesis stops is independent of the GFPmut3b molecules produced as all the [AHL] level off at the same time. This shows that the LuxR under the control of pTet is the major source of energy consumption. The pTet is a very strong promoter and is a big consumer of the energy of the chassis. This highlights the advantages of using the construct 2 [http://partsregistry.org/Part:BBa_J37032 pLux-GFPmut3b] that does not have the energetic burden of producing LuxR under pTet. <br><br> |
| - | + | Figure 1.4 shows us the following: | |
| - | + | *The shape of the '''Transfer function''' shows a linear range of response between 5nM and 100nM AHL. This defines the thresholds of response. | |
| - | + | *The '''lower threshold of response''' is the AHL concentration that the construct will respond | |
| - | <br | + | *The '''upper threshold of response''' is the value of AHL the system is saturated and increasing AHL will not increase the rate of GFP synthesis.<br><br> |
| - | + | ||
| - | + | ||
|} | |} | ||
| - | |||
| - | |||
| - | |||
| - | |||
| - | |||
| - | |||
| - | |||
| - | |||
| - | |||
| - | |||
| - | |||
| - | |||
| - | |||
| - | |||
| - | |||
| - | |||
| - | |||
| - | |||
| - | |||
| - | |||
| - | |||
| - | |||
| - | |||
| - | |||
| - | |||
| - | |||
| - | |||
| - | |||
| - | |||
| - | |||
| - | |||
| - | |||
| - | |||
| - | |||
| - | |||
| - | |||
| - | |||
| - | |||
| - | |||
| - | |||
| - | |||
| - | |||
| - | |||
| - | |||
| - | |||
| - | |||
| - | |||
| - | |||
| - | |||
| - | |||
| - | |||
| - | |||
| - | |||
| - | |||
| - | |||
| - | |||
| - | |||
| - | |||
| - | <center> [https://2007.igem.org/Imperial/Infector_Detector/Implementation<< Implementation] | Testing | [https://2007.igem.org/Imperial/Infector_Detector/ | + | <center> [https://2007.igem.org/Imperial/Infector_Detector/Implementation<< Implementation] | Testing | [https://2007.igem.org/Imperial/Infector_Detector/F2620_Comparison F2620 Comparison >>] |
</center> | </center> | ||
Latest revision as of 02:14, 27 October 2007

Infector Detector: Testing
Summary
The key results of the testing were:
- The optimum DNA concentration for [http://partsregistry.org/Part:BBa_T9002 pTet-LuxR-pLux-GFPmut3b] in our Commcercial S30 Cell extract is 4µg.
- Several of the specifications have been tested and met:
- Input:Sensitivity to 5-50nM AHL
- Operating Conditions:25oC
- Response Time:Response time to of visual threshold not determined, but peak fluorescence is reached at ~300 minutes.
Aims
From the initial testing we determined that the construct worked in both in vivo and in vitro. Now we were concerned with:
- Optimization - To test and obtain the optimal DNA concentration for construct 1 in vitro to reach the full potential of our infecter detector system.
- Test our specifications - To test the range 5-50nM AHL defined in our specifications and characterise the output of GFPmut3b for a range of AHL inputs. We aimed to measure fluorescence and using our calibration curve convert to molecules of GFPmut3b, click here for our calibration curve and for how we used it to convert
Results
DNA Concentrations
 Fig.1.1:Molecules of GFPmut3b synthesised over time, for each DNA Concentration in vitro at 25oC - The fluorescence was measured over time for each experiment and converted into molecules of GFPmut3b in vitro using our calibration curve Click here for results and protocol. |
The Results above show that the optimum DNA concentration for in vitro is 4µg for 50nM AHL. From figure 1.1. and 1.2 it can be seen that as DNA concentration increases above 4µg the GFPmut3b molecules synthesised decrease. Interestingly for figure 1.2 the graph can be split into several regions of how the DNA concentration changes the output of GFPmut3b synthesis:
The fact that increasing DNA concentration above 4µg causes a decrease in rate of protein synthesis is very interesting. The reason for this is thought to be that increasing DNA concentration causes problems with premature translational termination. |
AHL Testing
 Fig.1.3: Molcules of GFPmut3b synthesised vs AHL concentrations at 25oC. The Testing was carried out for the 4µg of DNA. Again the fluorescence reading was converted into GFPmut3b molecules via the calibration curve. Click for full results and protocols can be found on the links results and protocol pages. |
Figure 1.3 shows us the following:
Figure 1.4 shows us the following:
|

