Imperial/Wet Lab/Results/Res1.8
From 2007.igem.org
(→Aims) |
(→Discussion) |
||
| Line 34: | Line 34: | ||
Figure 1.1 and Figure 1.2. show us that the synthesis of GFPmut3b increases with DNA added. Though the molecules of GFPmut3b synthesised increases with increasing DNA concentration, even after a concentration of 4µg. This is not what was expected because of the nature of the cell free chassis which is optimum DNA concentration = 4µg. However, after 2µg the difference in molecules of GFP produced becomes very small and when the standard dievation is taken into account the differences looks like it is negligible. If DNA concentration is increased from 2µg to 6µg (a percentage increase of 200%), it reuslts in only about 15% increase (at 360min) in GFPmut3b molecules synthesised. | Figure 1.1 and Figure 1.2. show us that the synthesis of GFPmut3b increases with DNA added. Though the molecules of GFPmut3b synthesised increases with increasing DNA concentration, even after a concentration of 4µg. This is not what was expected because of the nature of the cell free chassis which is optimum DNA concentration = 4µg. However, after 2µg the difference in molecules of GFP produced becomes very small and when the standard dievation is taken into account the differences looks like it is negligible. If DNA concentration is increased from 2µg to 6µg (a percentage increase of 200%), it reuslts in only about 15% increase (at 360min) in GFPmut3b molecules synthesised. | ||
| - | <br>The different DNA concentrations have a similar shape graph on figure 1.1. In addition the 2µg,4µg and 6µg show very similar response.Thus it was decided that a DNA concentration of 2 or 4&micor;g will be used for testing pTet-GFPmut3b construct. | + | <br>The different DNA concentrations have a similar shape graph on figure 1.1. In addition the 2µg, 4µg and 6µg samples show very similar response. Thus it was decided that a DNA concentration of 2 or 4&micor;g will be used for testing pTet-GFPmut3b construct. |
| - | When the results for this experiment are compared to a similar experiment carried out for [[Imperial/Wet_Lab/Results/ID2.1|'''pTet-LuxR-pLux-GFPmut3b''']] the difference in optimum DNA concentration becomes apparent. The '''pTet-LuxR-pLux-GFPmut3b''' showed an optimum at 4µg, above which the output of GFP molecules decreases. This is not the case for '''pTet-GFPmut3b''' | + | When the results for this experiment are compared to a similar experiment carried out for [[Imperial/Wet_Lab/Results/ID2.1|'''pTet-LuxR-pLux-GFPmut3b''']] the difference in optimum DNA concentration becomes apparent. The '''pTet-LuxR-pLux-GFPmut3b''' showed an optimum at 4µg, above which the output of GFP molecules decreases. This is not the case for '''pTet-GFPmut3b'''. Although there was no increase in fluorescence above 4µg DNA, there was no decrease either. |
| - | Promega quote that the optimum for the commercial cell extract is 4µg, above which there is a decrease in protein synthesis because of premature termination of translation.The reason for the difference in optimum DNA concentration must be in the constructs used. '''pTet-LuxR-pLux-GFPmut3b''' is a large construct that | + | Promega quote that the optimum for the commercial cell extract is 4µg, above which there is a decrease in protein synthesis because of premature termination of translation.The reason for the difference in optimum DNA concentration must be in the constructs used. '''pTet-LuxR-pLux-GFPmut3b''' is a large construct that produces two proteins; LuxR and GFPmut3b. In contrast the '''pTet-GFPmut3b''' is a smaller construct that only produces GFPmut3b. Hence when DNA concentration of '''pTet-LuxR-pLux-GFPmut3b''' increases, more energy of the system is spent on production of the LuxR protein rather than synthesis of GFP; this is also due to the fact that pTet is a strong promoter, and induces high transcription rate of LuxR. |
==Conclusion== | ==Conclusion== | ||
To conclude the following approximations can be made: | To conclude the following approximations can be made: | ||
Optimum DNA concentrations - 2 or 4µg of DNA | Optimum DNA concentrations - 2 or 4µg of DNA | ||
Latest revision as of 02:38, 27 October 2007

Testing DNA concentration of pTet-GFPmut3b In vitro
Aims
To determine the optimum concentration of [http://partsregistry.org/Part:BBa_I13522 pTet-GFPmut3b] in vitro.
Materials and Methods
Link to Protocols page
Results
Controls:
- Negative Control- Nuclease Free Water was added instead of DNA
Constants:
- Temperature - 37°C
- Total Volume - 60µl
Raw Data
Discussion
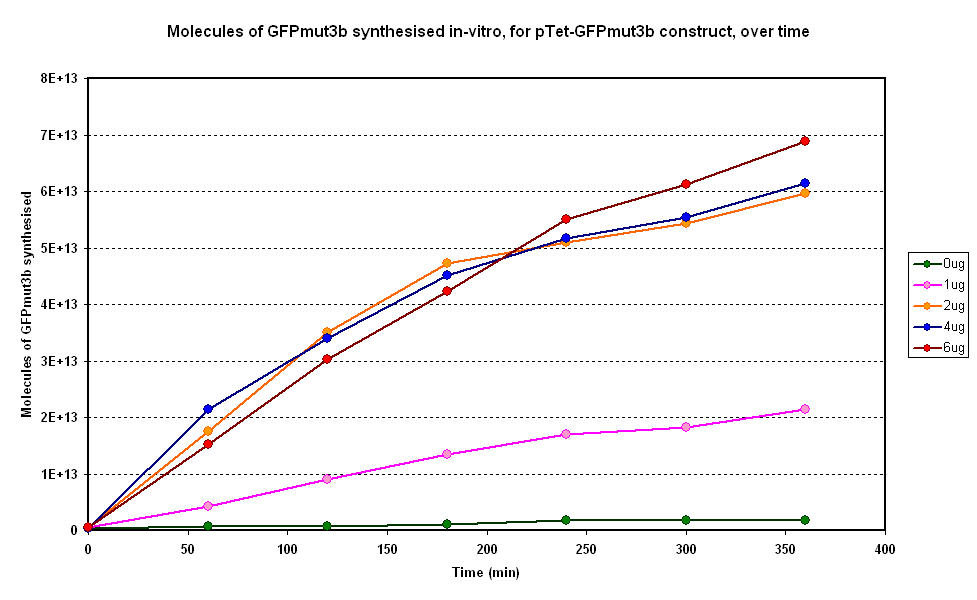
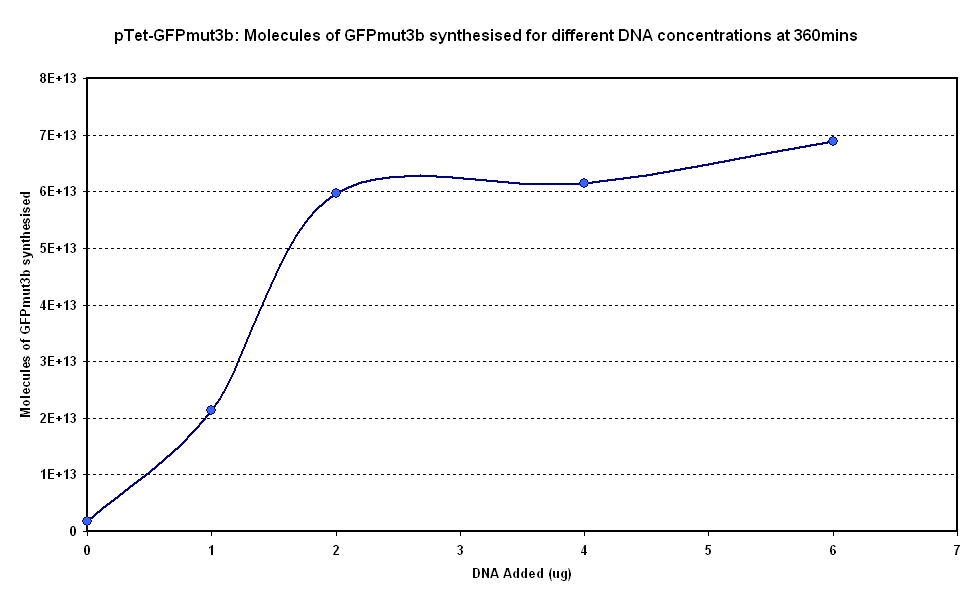
Figure 1.1 and Figure 1.2. show us that the synthesis of GFPmut3b increases with DNA added. Though the molecules of GFPmut3b synthesised increases with increasing DNA concentration, even after a concentration of 4µg. This is not what was expected because of the nature of the cell free chassis which is optimum DNA concentration = 4µg. However, after 2µg the difference in molecules of GFP produced becomes very small and when the standard dievation is taken into account the differences looks like it is negligible. If DNA concentration is increased from 2µg to 6µg (a percentage increase of 200%), it reuslts in only about 15% increase (at 360min) in GFPmut3b molecules synthesised.
The different DNA concentrations have a similar shape graph on figure 1.1. In addition the 2µg, 4µg and 6µg samples show very similar response. Thus it was decided that a DNA concentration of 2 or 4&micor;g will be used for testing pTet-GFPmut3b construct.
When the results for this experiment are compared to a similar experiment carried out for pTet-LuxR-pLux-GFPmut3b the difference in optimum DNA concentration becomes apparent. The pTet-LuxR-pLux-GFPmut3b showed an optimum at 4µg, above which the output of GFP molecules decreases. This is not the case for pTet-GFPmut3b. Although there was no increase in fluorescence above 4µg DNA, there was no decrease either.
Promega quote that the optimum for the commercial cell extract is 4µg, above which there is a decrease in protein synthesis because of premature termination of translation.The reason for the difference in optimum DNA concentration must be in the constructs used. pTet-LuxR-pLux-GFPmut3b is a large construct that produces two proteins; LuxR and GFPmut3b. In contrast the pTet-GFPmut3b is a smaller construct that only produces GFPmut3b. Hence when DNA concentration of pTet-LuxR-pLux-GFPmut3b increases, more energy of the system is spent on production of the LuxR protein rather than synthesis of GFP; this is also due to the fact that pTet is a strong promoter, and induces high transcription rate of LuxR.
Conclusion
To conclude the following approximations can be made: Optimum DNA concentrations - 2 or 4µg of DNA

