Imperial/Cell-Free/Characterisation
From 2007.igem.org
| Line 3: | Line 3: | ||
= Cell-Free: Characterisation = | = Cell-Free: Characterisation = | ||
| - | + | == Introduction == | |
| - | == Purpose == | + | === Purpose === |
In this section we analyse the data we have obtained on the cell-free chassis using GFP as the reporter. We show that the classic model for the synthesis of a protein by a constitutive promoter is not adapted and introduce a new model where synthesis is curbed by the resources left in the system. Finally we estimate the parameters of this new model from our data and show that it yields a much better fit. | In this section we analyse the data we have obtained on the cell-free chassis using GFP as the reporter. We show that the classic model for the synthesis of a protein by a constitutive promoter is not adapted and introduce a new model where synthesis is curbed by the resources left in the system. Finally we estimate the parameters of this new model from our data and show that it yields a much better fit. | ||
| - | == Prior Knowledge == | + | === Prior Knowledge === |
* pTet and pT7 are constitutive promoters that are commonly used ''in vivo'' for ''E. coli'' | * pTet and pT7 are constitutive promoters that are commonly used ''in vivo'' for ''E. coli'' | ||
* [[Imperial/Wet_Lab/Protocols/asdasdasf|Tests]] ''in vitro'' have demonstrated that they also work on the cell-free chassis | * [[Imperial/Wet_Lab/Protocols/asdasdasf|Tests]] ''in vitro'' have demonstrated that they also work on the cell-free chassis | ||
* Manufacturer specifications: the solution has been optimised so the degradation of proteins is minimal. We therefore expect our analysis to find very small degradation terms | * Manufacturer specifications: the solution has been optimised so the degradation of proteins is minimal. We therefore expect our analysis to find very small degradation terms | ||
| - | == Available Data == | + | === Available Data === |
We need as many data as possible and also data that are as varied as possible (data with similar behaviour will lead to the selection of a model that is too simple to predict all the behaviours that can be generated by the chassis). | We need as many data as possible and also data that are as varied as possible (data with similar behaviour will lead to the selection of a model that is too simple to predict all the behaviours that can be generated by the chassis). | ||
| Line 42: | Line 42: | ||
In all cases the initial concentration of GFP was X<sub>0</sub> = 0. The solution of the equation is known explicitly. It is | In all cases the initial concentration of GFP was X<sub>0</sub> = 0. The solution of the equation is known explicitly. It is | ||
[[Image:IC07_CFSeqn2.png|center|140px]] | [[Image:IC07_CFSeqn2.png|center|140px]] | ||
| + | |||
| + | {| align="center" | ||
| + | |- | ||
| + | ||[[Image:IC07_CFSdeg1.png|left|400px]] | ||
| + | ||[[Image:IC07_CFSk1.png|left|400px]] | ||
| + | |} | ||
| + | |||
| + | |||
| + | === Principle of our Data Analysis === | ||
| + | |||
| + | Instead of analysing each experiment in isolation (for instance pTet at 25 degrees), we used several experiments in coordination. The idea was to force our data analysis routine to return only one degradation term for the whole series of experiment (since the degradation term is chassis-dependent) and one synthesis rate per experiment (the rate K is promoter and temperature dependent, that is in our case experiment-dependent). | ||
| + | |||
| + | The algorithm we developed for our data analysis used the scaling properties of the solutions of the differential equations. | ||
| + | We let the time scale of the system (which is the chassis-dependent degradation term δ) run over a range of possible values and then we adjusted for each experiment the amplitude scale (the synthesis rate K) so the interpolation error was minimal for the experiment. The time scale (and the K’s) corresponding to the smallest overall error were then returned. | ||
| + | |||
| + | More details on the algorithm can be found in this complementary documentation (Wiki link to pdf). | ||
| + | |||
| + | ==== Analysis 1 ==== | ||
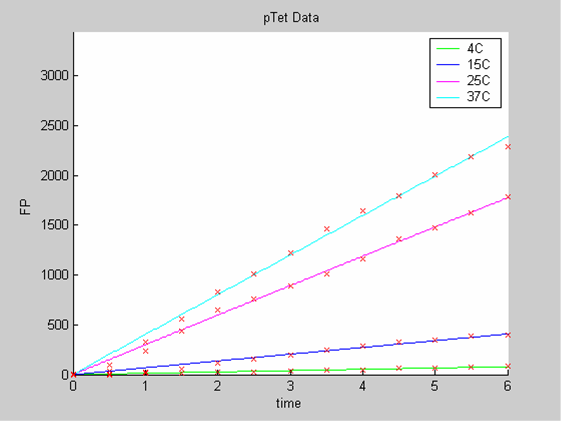
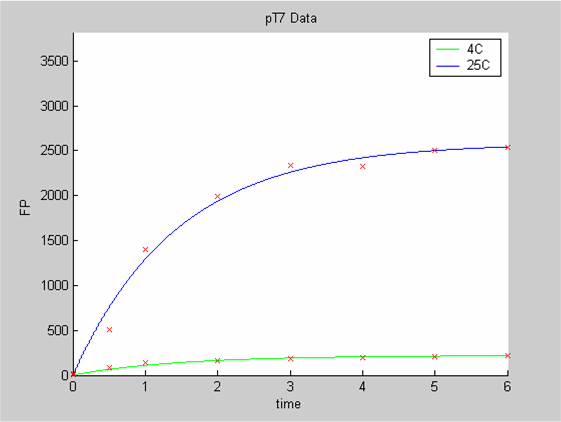
| + | We first analysed both promoter datasets (the pTet dataset and the pT7) independently. As can be seen below the model provides a good fit for each dataset. | ||
| + | |||
| + | {| align="center" | ||
| + | |- | ||
| + | ||[[Image:IC07_CFSpTet1.png|left|400px]] | ||
| + | ||[[Image:IC07_CFSpT71.png|left|400px]] | ||
| + | |} | ||
| + | |||
| + | The degradation term of the chassis was estimated to be 0.004/hour with the pTet data, which is consistent with statements of the manufacturer of the cell-free extract. However the pT7 data yield a very high degradation term (0.7/hour). The difference is high enough to suggest that the cause of such a variation is not rooted in the variability between two batches of cell extract. | ||
| + | |||
| + | ==== Analysis 2 ==== | ||
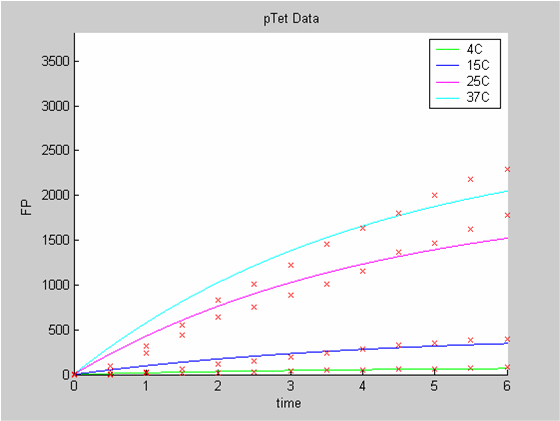
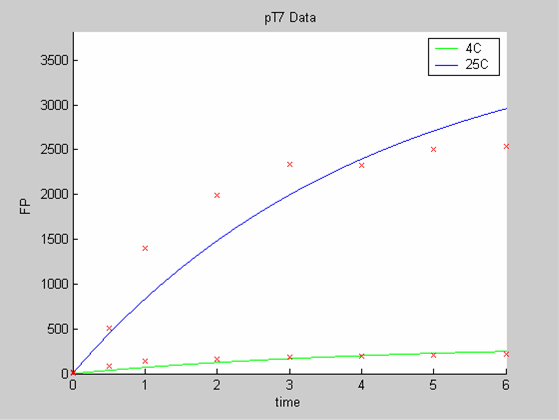
| + | When we analyse both datasets together the classic model yields a poor fit to our data as it fails to reconcile the linear behaviour of the pTet data with that of pT7 at 25 degrees (see images below). The estimated degradation is also high (degradation term = 0.24167) | ||
| + | |||
| + | {| align="center" | ||
| + | |- | ||
| + | ||[[Image:IC07_CFSpTet2.png|left|400px]] | ||
| + | ||[[Image:IC07_CFSpT72.png|left|400px]] | ||
| + | |} | ||
| + | ''Axes: time in hours''<br> | ||
| + | ''FP is the concentration of Fluorescent Protein (GFP here) in nanomol/l'' | ||
| + | |||
| + | ''Red crosses= experimental data''<br> | ||
| + | ''Full lines: Interpolation'' | ||
| + | |||
| + | ==== Conclusion ==== | ||
| + | The results of the data analysis with the classic model strongly '''suggest that the classic model is ill adapted to the description of protein synthesis in our cell free chassis. ''' | ||
Revision as of 23:18, 25 October 2007

Cell-Free: Characterisation
Introduction
Purpose
In this section we analyse the data we have obtained on the cell-free chassis using GFP as the reporter. We show that the classic model for the synthesis of a protein by a constitutive promoter is not adapted and introduce a new model where synthesis is curbed by the resources left in the system. Finally we estimate the parameters of this new model from our data and show that it yields a much better fit.
Prior Knowledge
- pTet and pT7 are constitutive promoters that are commonly used in vivo for E. coli
- Tests in vitro have demonstrated that they also work on the cell-free chassis
- Manufacturer specifications: the solution has been optimised so the degradation of proteins is minimal. We therefore expect our analysis to find very small degradation terms
Available Data
We need as many data as possible and also data that are as varied as possible (data with similar behaviour will lead to the selection of a model that is too simple to predict all the behaviours that can be generated by the chassis).
For this section we will use
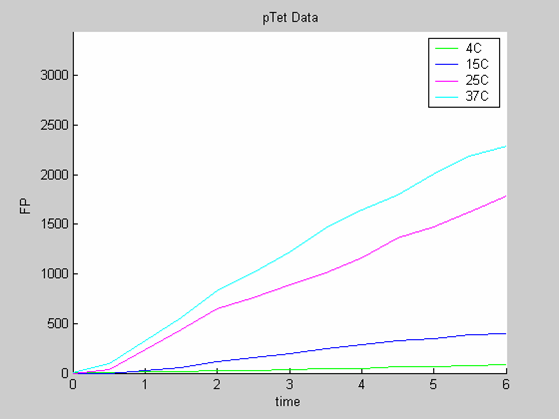
- the data collected with pTet at 4,15,25 and 37 degrees (link to wiki page) that exhibit a linear behaviour
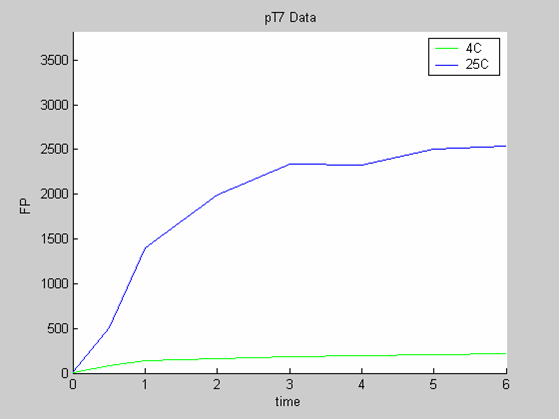
- the pT7 data at 4 and 25 degrees (link to wiki page) that exhibit a saturated behaviour.
We use the calibration curve of GFP (link to wiki page) to convert the fluorescence data into concentrations (in this case the concentrations were express in nanomols/l).
Axes: time in hours
FP is the concentration of Fluorescent Protein (GFP here) in nanomol/l
The Classic Model
To analyse our data we use the classic approach that consists of modelling the evolution with time of the concentrations of the product of interest. In this case the model is the simplest we can imagine:
- We have only one protein GFP
- It is constitutively synthesized at a constant synthesis rate K. K depends on the promoter that is used and ourdata show that it is also temperature-dependent
- The protein is then degraded. This degradation term δ depends on the protein and on the chassis. We can assume the impact of temperature to be negligible.
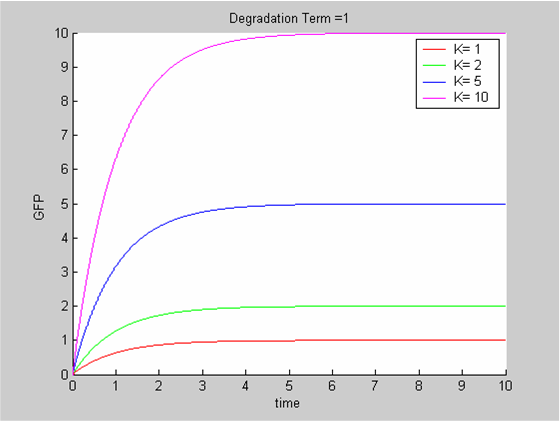
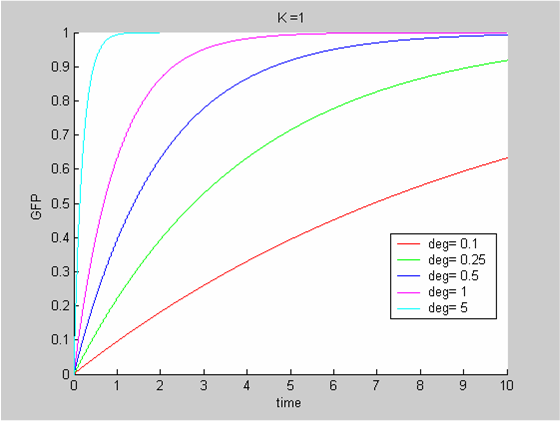
The differential equation governing the evolution of X , the concentration of GFP is
In all cases the initial concentration of GFP was X0 = 0. The solution of the equation is known explicitly. It is
Principle of our Data Analysis
Instead of analysing each experiment in isolation (for instance pTet at 25 degrees), we used several experiments in coordination. The idea was to force our data analysis routine to return only one degradation term for the whole series of experiment (since the degradation term is chassis-dependent) and one synthesis rate per experiment (the rate K is promoter and temperature dependent, that is in our case experiment-dependent).
The algorithm we developed for our data analysis used the scaling properties of the solutions of the differential equations. We let the time scale of the system (which is the chassis-dependent degradation term δ) run over a range of possible values and then we adjusted for each experiment the amplitude scale (the synthesis rate K) so the interpolation error was minimal for the experiment. The time scale (and the K’s) corresponding to the smallest overall error were then returned.
More details on the algorithm can be found in this complementary documentation (Wiki link to pdf).
Analysis 1
We first analysed both promoter datasets (the pTet dataset and the pT7) independently. As can be seen below the model provides a good fit for each dataset.
The degradation term of the chassis was estimated to be 0.004/hour with the pTet data, which is consistent with statements of the manufacturer of the cell-free extract. However the pT7 data yield a very high degradation term (0.7/hour). The difference is high enough to suggest that the cause of such a variation is not rooted in the variability between two batches of cell extract.
Analysis 2
When we analyse both datasets together the classic model yields a poor fit to our data as it fails to reconcile the linear behaviour of the pTet data with that of pT7 at 25 degrees (see images below). The estimated degradation is also high (degradation term = 0.24167)
Axes: time in hours
FP is the concentration of Fluorescent Protein (GFP here) in nanomol/l
Red crosses= experimental data
Full lines: Interpolation
Conclusion
The results of the data analysis with the classic model strongly suggest that the classic model is ill adapted to the description of protein synthesis in our cell free chassis.
