Imperial/Infector Detector/F2620 Comparison
From 2007.igem.org
m (→Comparison to F2620) |
m (→Comparison to F2620) |
||
| Line 28: | Line 28: | ||
<br clear=all> | <br clear=all> | ||
{|align="center" | {|align="center" | ||
| - | | width="200px"|<br><center>[[ | + | | width="200px"|<br><center>[[image:IC2007 BF stage1 construct.PNG |thumb|700px]]</center> |
|} | |} | ||
Revision as of 23:17, 25 October 2007

Comparison to F2620
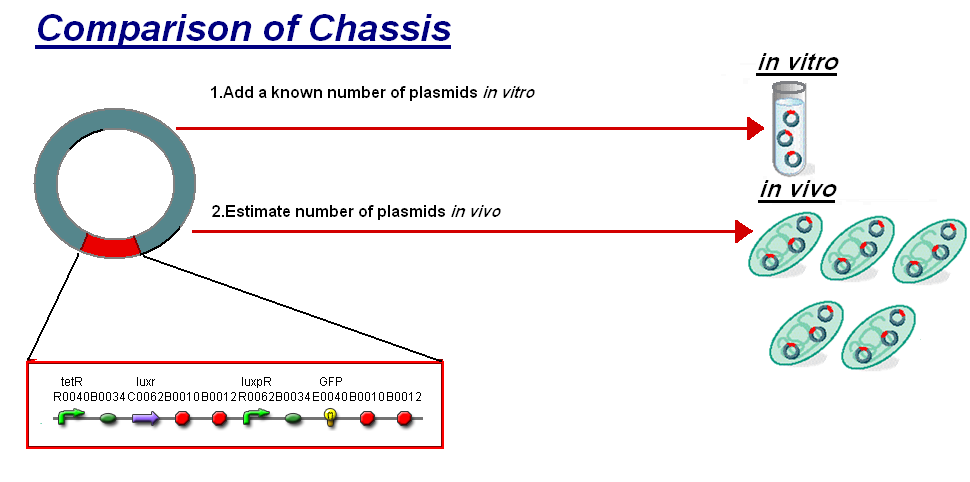
For further analysis the results of our in vitro testing have been compared to the work in vivo on [http://partsregistry.org/Part:BBa_F2620 BBa_F2620](pTet-LuxR-pLux-GFPmut3b), the construct being the same as our construct 1 for infecter detector. The motivation of the comparison is to see how this construct will respond in different chassis. To do this we investigated a standard unit s to allow the comparison between in vitro and in vivo.
The basis for comparison is to normalise the in vitro chassis on the number of plasmids to give a platform for comparison:
- In Vitro - 4µg of DNA was added which for [http://partsregistry.org/Part:BBa_T9002 pTet-LuxR-pLux-GFPmut3b] is 904823007 plasmids
- In Vivo - Each cell the plasmids number was estimated at 30 per cell
To compare we normalised the data of in vitro GFPmut3b molecules synthesised per 30 plasmids to allow some comparison to the in vivo data.
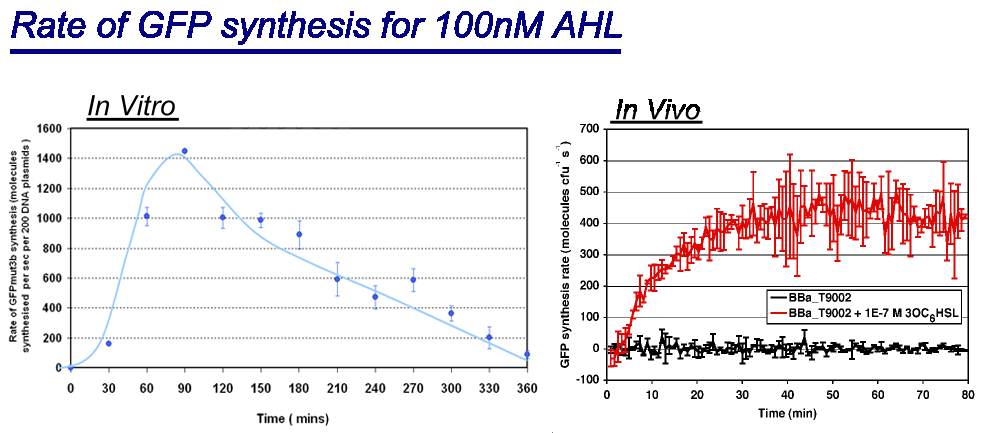
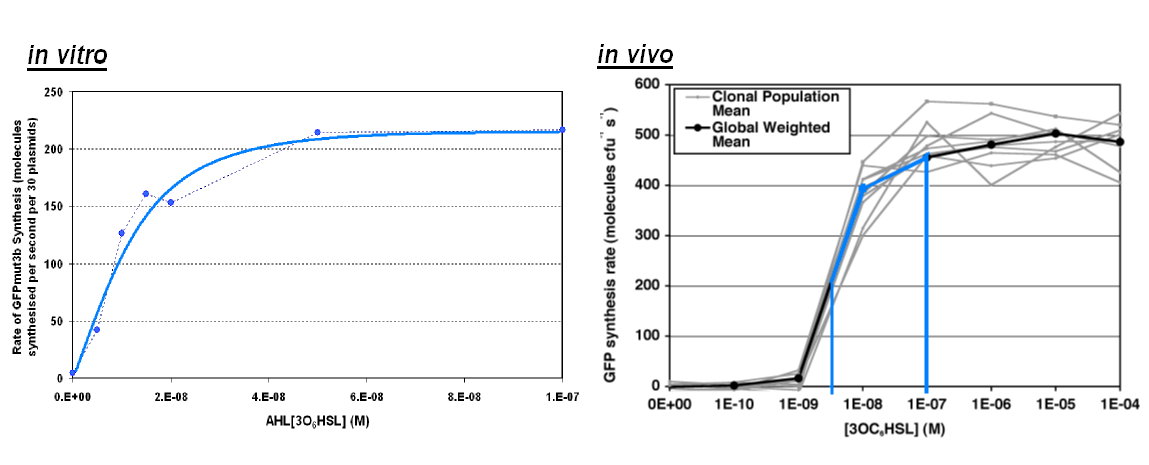
Of particular interest was to compare the Rate of GFP synthesis of 100nM and the Transfer Function.
Rate of GFPmut3b Synthesis for 100nM AHL
Transfer Function
Summary
Below is list of which of the orginial Specifications that our infecter detector achieved:
| Achievements | ||
| Inputs | Sensitive to 5-1000nM | |
| Outputs | Future work - Using Stronger fluorescent protein such as DsRed express | |
| Response Time | Systems responds <30minutes | |
| Operating Conditions | System works at 25°C | |
| Health & Safety | Cell Free in vitro chassis | |
| Lifespan | Can be stored in freezer for prolonged periods | |
| Packaging | Future Work - Using our chassis in a spray |


