Imperial/Dry Lab/Data Analysis
From 2007.igem.org
m |
m |
||
| Line 1: | Line 1: | ||
{{Template:IC07navmenu}} | {{Template:IC07navmenu}} | ||
<br clear="all"> | <br clear="all"> | ||
| - | + | __NOTOC__ | |
=Data Analysis= | =Data Analysis= | ||
Revision as of 19:29, 26 October 2007

Data Analysis
Introduction
Data analysis involves manipulating experimental data with the objective of extracting useful information. This then allows us to test our original hypotheses surrounding the problem, and in doing so, test the stringency/validity of our representative model.
If the model proves to be valid, data analysis likewise provides a means of parameter extraction essential in rendering our theoretical model more realistic (as it gleans parameters from actual expimental data).
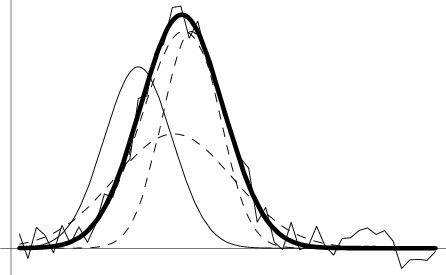
Our approach to data analysis utilizes curve/shape-fitting by non-linear regression (employing the least-squares method).
Principle of method of parameter extraction
The method uses weighted non-linear leasts-squares. This technique involves obtaining the best-fitting non-linear curve for a given set of parameters from the parameter space. This procedure involves minimizing the sum of the squares of the offsets from the chosen curve. [http://mathworld.wolfram.com/LeastSquaresFitting.html] Here, the offsets refering to the difference between the chosen non-linear curve and the experimental data, at a particular value of the independent variable.
A weighted non-linear least-squares is used, so that that the integrity of the data does not corrupt the extracted parameters. Weightings are assigned to adjacent experimental data points, according to their variance from the general trend/behaviour.
Representative example
Consider the following model

