Imperial/Cell by Date/Testing
From 2007.igem.org
m (→<font color=blue>Investigating properties of system under dynamic temperature scenarios</font>) |
m (→Summary) |
||
| Line 23: | Line 23: | ||
Key results of our experiments are : | Key results of our experiments are : | ||
| - | 1.Operating Range : Our System Operates between 8-37 Degrees <br> | + | 1.'''Operating Range''' : Our System Operates between '''8-37 Degrees''' <br> |
| - | 2.Activation Energy : The activation energy of our system is 1.5kJ/mol <br> | + | 2.'''Activation Energy''' : The activation energy of our system is '''1.5kJ/mol''' <br> |
| - | 3.DNA Concentration : The optimum DNA concentration for our system is 2-4ug DNA <br> | + | 3.'''Optimum DNA Concentration''' : The optimum DNA concentration for our system is '''2-4ug DNA''' <br> |
==Aims== | ==Aims== | ||
Revision as of 01:15, 27 October 2007

Cell by Date: Testing
Summary
Key results of our experiments are :
1.Operating Range : Our System Operates between 8-37 Degrees
2.Activation Energy : The activation energy of our system is 1.5kJ/mol
3.Optimum DNA Concentration : The optimum DNA concentration for our system is 2-4ug DNA
Aims
Having determined that our system worked at a basic level in our implementation phase we set out to ascertain a clearer picture of the performance of our system to ultimately reveal whether our design had realised our specifications.
Results
Investigating properties of system under isothermal scenarios
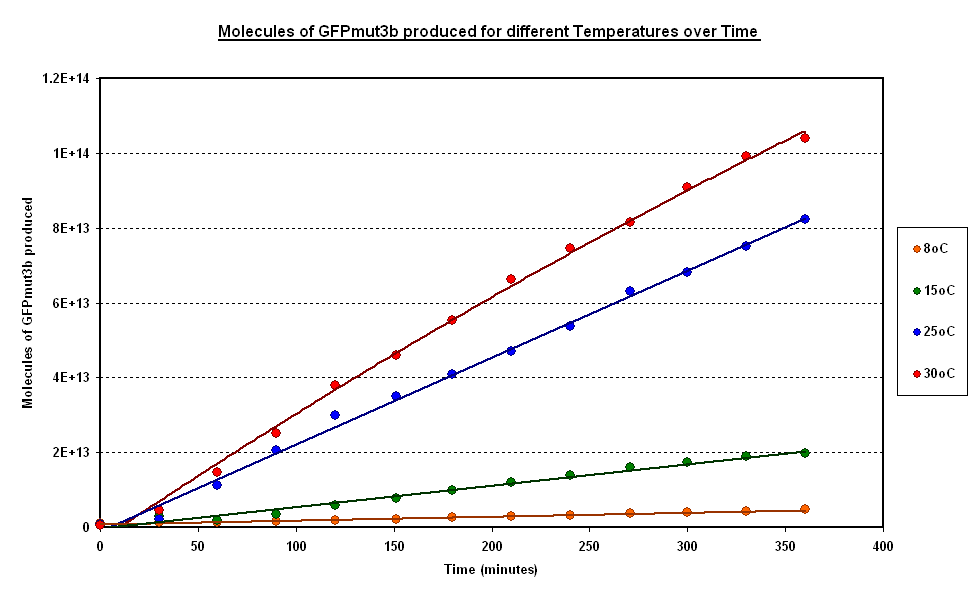
To estimate the properties of our system we looked at the evolution of the Fluorescence with time for experiments where temperature is carefully kept constant. (Figure 1).
General Behaviour:
- In all experiment we can observe a linear growth of fluorescence corresponding to a steady rate of protein production.
- This matches the claims of the manufacturer of the cell-free extract that the extract is optimised so that protein degradation is negligible.
Operating Range:
- Our system seems to 'turn off' at around 4 degrees C.
- At 8 degrees with have minimal expression which then increases to a substantial expression at 37 degrees.
Synthesis rate vs Temperature
- Over the range of temperature considered here the rate increases with temperature.
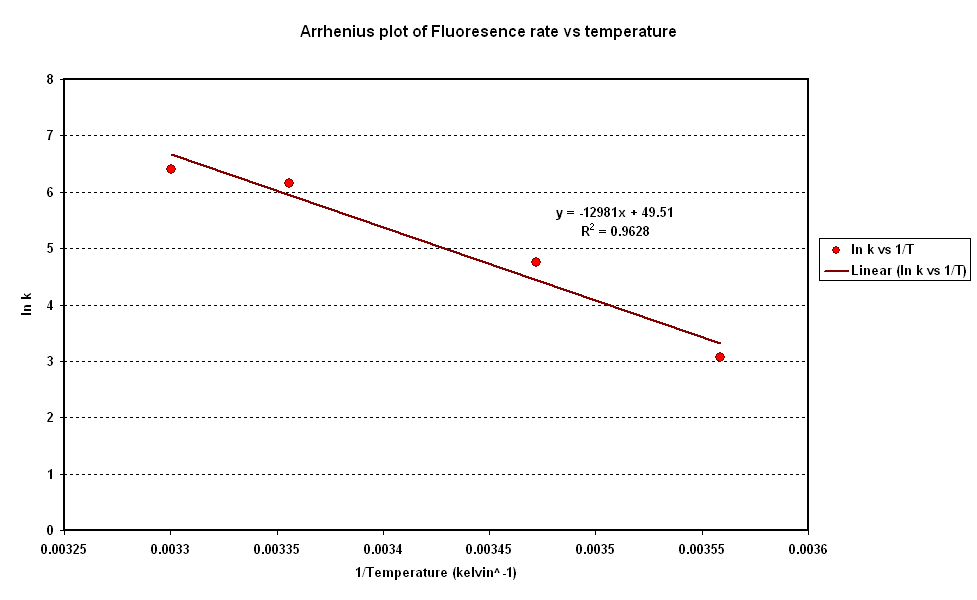
- To investigate the relation between synthesis rate and temperature we extracted the rate of synthesis of GFP for each experiment and plotted it against 1/T (Figure 2).
- A strong linear correlation in the log plot supports an arrhenius type dependence on temperature with an activation energy of 1.5kJ/mol.
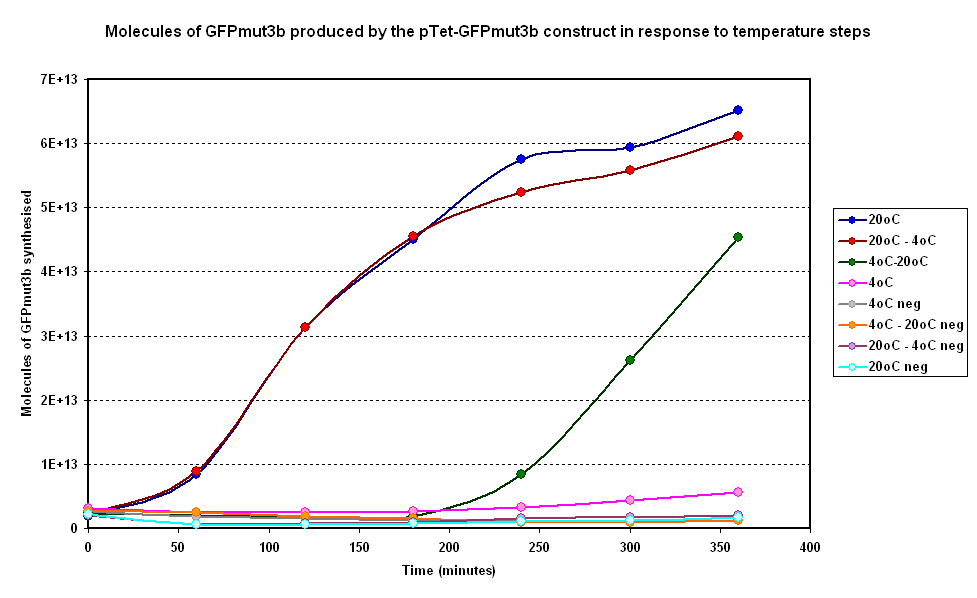
Investigating properties of system under dynamic temperature scenarios
Other practical considerations:
- Unfortunetly we have not been able to use a visible reporter and so have no idea whether the construct can in fact produce a visible signal.
- In terms of lifespan we have had major problems with evaporation meaning that the lifespan of our system is limited to a few days as discussed in our packaging experiment below.
Other Experiments
1. DNA Concentration
2. Packaging


