Bologna
From 2007.igem.org
(→Acknowledgments) |
(→Overview Table) |
||
| (65 intermediate revisions not shown) | |||
| Line 27: | Line 27: | ||
| - | Our team: [[Bologna_University/FB | Francesca Buganè]], [[Bologna_University/MM| Michela Mirri]], [[Bologna_University/FP | Francesco Pasqualini]], and [[Bologna_University/ST | Silvia Tamarri]], all undergraduate students in Biomedical Engineering; [[Bologna_University/GC | Guido Costa]], undergraduate student in Electronic Engineering; [[Bologna_University/IB | Iros Barozzi]], undergraduate student in Industrial Biotechnology and Bioinformatics and [[Bologna_University/AP | Alice Pasini]], | + | Our team: [[Bologna_University/FB | Francesca Buganè]], [[Bologna_University/MM| Michela Mirri]], [[Bologna_University/FP | Francesco Pasqualini]], and [[Bologna_University/ST | Silvia Tamarri]], all undergraduate students in Biomedical Engineering; [[Bologna_University/GC | Guido Costa]], undergraduate student in Electronic Engineering; [[Bologna_University/IB | Iros Barozzi]], undergraduate student in Industrial Biotechnology and Bioinformatics and [[Bologna_University/AP | Alice Pasini]], PhD student in Biochemistry. |
We are advised by: [http://www.ing2.unibo.it/Ingegneria+Cesena/Strumenti+del+Portale/Cerca/paginaWebDocente.htm?NRMODE=Published&TabControl1=TabContatti&UPN=emanuele.giordano%40unibo.it Dr Emanuele Giordano], Lecturer in Biochemistry and [http://www-micro.deis.unibo.it/cgi-bin/user?tartagni Prof. Marco Tartagni], Professor of Electronics. We are grateful to our advisors for their time and support! | We are advised by: [http://www.ing2.unibo.it/Ingegneria+Cesena/Strumenti+del+Portale/Cerca/paginaWebDocente.htm?NRMODE=Published&TabControl1=TabContatti&UPN=emanuele.giordano%40unibo.it Dr Emanuele Giordano], Lecturer in Biochemistry and [http://www-micro.deis.unibo.it/cgi-bin/user?tartagni Prof. Marco Tartagni], Professor of Electronics. We are grateful to our advisors for their time and support! | ||
| Line 43: | Line 43: | ||
'''Pardon me, what do you mean?''' (AKA '''Functional Requirements''') <br \> | '''Pardon me, what do you mean?''' (AKA '''Functional Requirements''') <br \> | ||
| - | The main | + | The main feature of this device is to be a “smart” switch: that means a switch with memory. |
| - | In a "stupid" switch when the input (some environmental condition) crosses a certain threshold the output (some switch properties) changes, for instance from on to off. Often the environmental change is the modification of the value | + | In a "stupid" switch when the input (some environmental condition) crosses a certain threshold the output (some switch properties) changes, for instance from on to off. Often the environmental change is the quantitative modification of the value that describes the environment (temperature, pressure, pH, ect). The "stupid" device switches just for a given value of the input (threshold). |
[[Image:switch_1.jpg|center]] | [[Image:switch_1.jpg|center]] | ||
| Line 60: | Line 60: | ||
| - | This kind of "smart” switch, the "Schmitt Switch", is largely used in technical applications since it | + | This kind of "smart” switch, the "Schmitt Switch", is largely used in technical applications since it overcomes the instability issue; in fact, the minimal variation able to cause a change in the output must be as large as the difference between the two thresholds. Then noise becomes not so critical. |
[[Image:scaldabagno3.jpg|center]] | [[Image:scaldabagno3.jpg|center]] | ||
| - | Figure 3.Typical application of the Schmitt Trigger: The boiler.''Once the water temperature passes the higher threshold, boiler turn off until temperature crosses the lower threshold. Since this system work in closed loop (temperature controls the heater that determines the temperature), it is able to automatically maintain a warm temperature: the temperature holds stable and so does your mood if you are in the bath tub.'' | + | Figure 3.Typical application of the Schmitt Trigger: The boiler.'' Once the water temperature passes the higher threshold, boiler turn off until temperature crosses the lower threshold. Since this system work in closed loop (temperature controls the heater that determines the temperature), it is able to automatically maintain a warm temperature: the temperature holds stable and so does your mood if you are in the bath tub.'' |
The reason why the “smart” switch works that well is due to its [http://en.wikipedia.org/wiki/Hysteresis hysteresis] properties. | The reason why the “smart” switch works that well is due to its [http://en.wikipedia.org/wiki/Hysteresis hysteresis] properties. | ||
| - | Our genetic circuit | + | Our genetic circuit aims to reproduce this fundamental property of Schmitt Trigger. |
'''How?''' (AKA '''Technical Requirements''')<br \> | '''How?''' (AKA '''Technical Requirements''')<br \> | ||
| - | + | To do it we exploited one of such genetic systems, existing in the complex of genes that form the Lac Operon shown in Figure 4. | |
| - | Namely, E. | + | Namely, ''E. coli'' can survive by metabolizing either glucose or lactose - in the case of lack of glucose. Lactose- or glucose-metabolizing modes are the two stable state of the system. To perform experiments we use IPTG a structural analog of lactose that cannot be metabolized. Thus the input of our system are the external concentrations of Glucose and IPTG (Gluex and IPTGex respectively). |
| - | Since lactose metabolism is more energy consuming, usually all the apparatus that takes care of the lactose metabolism is repressed. | + | Since lactose metabolism is more energy consuming, usually all the apparatus that takes care of the lactose metabolism is repressed. It is [http://en.wikipedia.org/wiki/Lac_operon the promoter pLac ] constitutively shut off by the presence of the LacI protein, that inhibits the transcription of the downstream genes in the operon ([http://bcs.whfreeman.com/mga2e/pages/bcs-main.asp?s=132&n=003&i=283&v=&o=&ns=0&uid=0&rau=0 this] is how it works). When IPTG is in the environment, several concurrent processes take place in the cell. IPTG flows across the membrane and after some processing it is able to quench the repressor LacI, thus allowing the transcription of ''lacY'' gene that in turn enhances IPTG uptake and increases its action on the repressor LacI. This represents the positive feedback loop we need. |
[[Image:schema1.jpg|center]] | [[Image:schema1.jpg|center]] | ||
| Line 82: | Line 82: | ||
| - | As it is the system can already perform like a Schmitt trigger, for certain values of the inputs. However there is another mechanism that allows the fine tuning of the system: glucose has a double action both on a molecule called cAMP that it bounds to, inhibiting its action on pLac expression (catabolite repression) and on the lactose, since it reduces its uptake (inducer exclusion). | + | As it is the system can already perform like a Schmitt trigger, for certain values of the inputs. However there is another mechanism that allows the fine tuning of the system: glucose has a double action both on a molecule called cAMP that it bounds to, inhibiting its action on pLac-driven gene expression (catabolite repression) and on the lactose, since it reduces its uptake (inducer exclusion). |
| Line 89: | Line 89: | ||
'''1.''' <u>''Controlled Gene Expression Trigger''</u> <br \> | '''1.''' <u>''Controlled Gene Expression Trigger''</u> <br \> | ||
| - | Manipulating gene expression using most of the current protocols in molecular biology usually relay either on a strong overexpression of a protein or on its total silencing. Once induced, both these two extreme perturbations are generally unmodifiable (so that this approaches, although shedding light on the general role of the candidate gene, are rough indicators of the effect of its real physiological transcriptional level). Our genetic device can limit these drawbacks offering 1) a controlled on-off transition of the protein expression at will (by dosing the extracellular IPTG input) and 2) its graded transcriptional level (playing with the extracellular Glucose concentration), representing a powerful tool for biologists. Moreover, in addition to the ability to control the timing and the extent of the induction, our device has the additional advantage to guarantee that small changes in the extracellular concentration of the inducer IPTG would not affect the stability of the level of the expression. | + | Manipulating gene expression using most of the current protocols in molecular biology usually relay either on a strong overexpression of a protein or on its total silencing. Once induced, both these two extreme perturbations are generally unmodifiable (so that this approaches, although shedding light on the general role of the candidate gene, are rough indicators of the effect of its real physiological transcriptional level). Our genetic device can limit these drawbacks offering 1) a controlled on-off transition of the protein expression at will (by dosing the extracellular IPTG input) and 2) its graded transcriptional level (playing with the extracellular Glucose concentration), representing a powerful tool for biologists. Moreover, in addition to the ability to control the timing and the extent of the induction, our device has the additional advantage to guarantee that small changes in the extracellular concentration of the inducer IPTG would not affect the stability of the level of the gene expression. |
'''2.''' <u>''Glucose Sensor''</u> <br \> | '''2.''' <u>''Glucose Sensor''</u> <br \> | ||
| - | + | A second application takes advantage of the external glucose dependence. In fact, we know that the expression of the system is stable, but its intensity depends on the glucose. We can reverse the perspective and observe the intensity of the expression to infer the abundance of glucose in the medium. | |
[[Image:introduz.jpg|center]] | [[Image:introduz.jpg|center]] | ||
Figure 5. ''Schematic view of our device'' | Figure 5. ''Schematic view of our device'' | ||
| - | |||
| - | |||
==Mathematical Model== | ==Mathematical Model== | ||
| - | Based on the our knowledge on the [http://en.wikipedia.org/wiki/Lac_operon Lac operon] and on the works of | + | Based on the our knowledge on the [http://en.wikipedia.org/wiki/Lac_operon Lac operon] and on the works of Santillàn et al. (2004, 2007), we decided to explore the behavior of a possible synthetic circuit which mimics the genetic circuit by modeling the parts depicted in Figure 6. |
[[Image:modellomath_def.jpg|center]] | [[Image:modellomath_def.jpg|center]] | ||
| Line 117: | Line 115: | ||
| - | These equations are sufficient to model the dynamics relevant to the functioning of the system and nor overly complex to avoid [[Bologna University/Equations mess | biologist | + | These equations are sufficient to model the dynamics relevant to the functioning of the system and nor overly complex, to avoid [[Bologna University/Equations mess | biologist melancholy]]. |
The inputs of this system are the extracellular concentrations of Glucose and IPTG, that are processed by the non linear functions described in the table below. | The inputs of this system are the extracellular concentrations of Glucose and IPTG, that are processed by the non linear functions described in the table below. | ||
| Line 150: | Line 148: | ||
[[Image:outputEqn.jpg|center]] | [[Image:outputEqn.jpg|center]] | ||
| - | All the genomic parameters (from Santillàn et al, 2007) are defined [[Bologna_University/Literature Parameters | here]], while the parameters adopted to model the synthetic parts | + | All the genomic parameters (from Santillàn et al, 2007) are defined [[Bologna_University/Literature Parameters | here]], while the parameters adopted to model the synthetic parts are defined in the table of [[Bologna University/SynthPar| Synthetic Parameters]]. |
===Numerical Simulation=== | ===Numerical Simulation=== | ||
| - | To analyse the circuit’s behaviour under different stimulations we | + | To analyse the circuit’s behaviour under different stimulations we implemented model equations in [[Bologna University/simulink | simulink]] (Mathworks). As model input we impose a periodic change in the extracellular IPTG levels (slow enough to assume that the system is near to the equilibrium for each IPTG value) while Glucose is kept constant. |
| - | Several simulations were | + | Several simulations were run by assigning a different value to Glucose. The results are shown in Figure 7: the system shows hysteresis, distinct thresholds depending on the Glucose and, once induced, constant level of expression. Notably, the circuit shows bistability (two stable equilibria) for IPTG values between the thresholds. |
| Line 163: | Line 161: | ||
| - | Dependence of IPTG thresholds on Glucose are shown in Figure 8: the points that lie between the | + | Dependence of IPTG thresholds on Glucose are shown in Figure 8: the points that lie between the thresholds are values (of the inputs) at which the system exhibit bistability; that is, we are not able of predict the final state with no information on the initial state. Outside these values, system reaches without any doubts, steady induced or uninduced state. |
[[Image:Stability_plane_def.jpg|center]] | [[Image:Stability_plane_def.jpg|center]] | ||
| - | Figure 8. ''Shows how the 2 thresholds | + | Figure 8. ''Shows how the 2 thresholds value changes for varying levels of external glucose. All the points that lie between the two curves represent states for which the trascription can occur or not, the points below the blue curve correspond to pLac full repression (trascription off) while points over the red curve correpond to a condition where Plac is partially repressed (trascription on).'' |
| - | When the higher threshold is crossed | + | When the higher threshold is crossed transcripion takes place with an expression level unsensitive to the ITPG stimulus (see Figure 7). In this condition (i.e. IPTG 900 microM), the saturation level depends on the Glucose (see figure 8), and the circuit acts like a glucose sensor. |
| Line 181: | Line 179: | ||
| - | In conclusion, numerical simulation | + | In conclusion, numerical simulation predicts a circuit functionality which is coherent with our initial speculation, i.e. the circuit presented in Figure 6 can operate like a [[#Introduction | Schmitt Trigger]]. |
| - | The values of few parameters | + | The values of few parameters were assigned with some uncertainty. In particular, we used a value of LacI that is about 30 times the genomic one for a circuit copy number of 10. Since these values can affect the model prediction we will perform specific experiment to identify this parameters. However, the LacI values was incresed in order to trigger off the system for low values of IPTG. To realize this increase we decided to build a sub-circuit where the LacI gene is under the control of pTet promoter. |
At the same way, the GFP steady state expression decreases with extracellular Glucose (see Figure 9), while we want, for an intuitive use of the sensor a fluorescent signal that increases with Glucose. To obtain this behavior we plan to build a sub-circuit that acts like an inverter, with an RFP under the control of pλ, and to put in the main circuit the cI gene which encode for the protein that regulates pλ. | At the same way, the GFP steady state expression decreases with extracellular Glucose (see Figure 9), while we want, for an intuitive use of the sensor a fluorescent signal that increases with Glucose. To obtain this behavior we plan to build a sub-circuit that acts like an inverter, with an RFP under the control of pλ, and to put in the main circuit the cI gene which encode for the protein that regulates pλ. | ||
| - | |||
| - | |||
==Image Acquisition and Analysis== | ==Image Acquisition and Analysis== | ||
| Line 522: | Line 518: | ||
===Fluorescence intensity dependence on Promoter type=== | ===Fluorescence intensity dependence on Promoter type=== | ||
| - | The three promoters used in the biodevice ([http://partsregistry.org/Part:BBa_I763004 I763004], [http://partsregistry.org/Part:BBa_I763035 I763035] and [http://partsregistry.org/Part:BBa_I763011 I763011]) have been characterized in order to gain useful information | + | The three promoters used in the biodevice ([http://partsregistry.org/Part:BBa_I763004 I763004], [http://partsregistry.org/Part:BBa_I763035 I763035] and [http://partsregistry.org/Part:BBa_I763011 I763011]) have been separately characterized in order to gain useful information for the model. We chose to characterize the behavior of promoters escluding the LacY positive feedback. |
| - | + | First, the three different intermediate parts have been tested in LB medium to stabilish differences in transcription rates. All of the three intermediates have GFP protein as a reporter to avoid difference in protein synthetis and degradation. | |
| - | + | Mesuarements have been performed at OD value of 1.2. We have taken pictures of two fields from each of the five slides we prepared; then, we calculated the mean value for each slide and finally the mean and the standard deviation on these values. | |
Results are in figure below: | Results are in figure below: | ||
[[Image:Istogramma1.jpg|center]] | [[Image:Istogramma1.jpg|center]] | ||
| - | |||
| - | + | ||
| + | Fluorescence intensity levels for [http://partsregistry.org/Part:BBa_I763004 I763004] and [http://partsregistry.org/Part:BBa_I763035 I763035] are similar, while [http://partsregistry.org/Part:BBa_I763011 I763011] beams a significantely lower fluorescence (30%). | ||
| + | |||
| + | |||
| + | Experiments have been repeated with bacteria grown into a different culture medium (M9 medium), that is the one chosen for testing the Genetic Schmitt Trigger. | ||
| + | Results are in figure below: | ||
| Line 539: | Line 539: | ||
| - | In this case, the three promoters produce levels of fluorescence | + | In this case, the three promoters produce levels of fluorescence significantely different being pTet the one with the highest transcription activity. |
| - | ===Comparison between fluorescence elicited by two | + | ===Comparison between fluorescence elicited by the two media=== |
| - | + | To highlight the differences between the two media, we have directely compared for each intermediate fluorescence intensity in the two media. | |
| + | The comparison is shown in figure below: | ||
[[Image:Istogramma3333.jpg|center]] | [[Image:Istogramma3333.jpg|center]] | ||
| - | Complete data set, summarized in the table below, | + | pλ promoter seems to not been influenced by the growth in different media. As expected, pLac promoter seems to have a higher transcription rate in a medium not added with carbon sources (M9 minimal medium). This result strictly agree with the prediction obtained by our mathematical model (20% experimental vs 23% simulation). Surprisingly, pTet promoter increases its activity changing the medium. We are not able to justify this result. Anyway, our mathematical model does not include such dependence and this aspect deserve to be investigated to be clarified. |
| + | |||
| + | |||
| + | Complete data set, summarized in the table below, is [[Bologna University/Fluo results (Promoter - Medium) | here]]. | ||
| + | |||
| + | |||
{| border="0" cellpadding="5" cellspacing="1" align="center" | {| border="0" cellpadding="5" cellspacing="1" align="center" | ||
| Line 573: | Line 579: | ||
|} | |} | ||
| + | ===Switch Time Course=== | ||
| + | |||
| + | We also tested the intermediate device pTet-LacI-pLac-GFP [http://partsregistry.org/Part:BBa_I763027 (I763027)] in a high copy plasmid [http://partsregistry.org/Part:pSB1A2 pSB1A2] to verify if it really works as a toggle switch.In this intermediate device only LacY is not included since we would study transcriptional activity without the positive feedback due to the lactose permease. | ||
| + | |||
| + | Following the [[Bologna University/Fluorescence Test | Fluorescence Test protocol]], bacteria grew in LB medium O/N. The day after we tested output fluorescence intensity in M9 with 1M glucose. We induced them with two different IPTG concentrations (2mM and 8mM) to activate pLac promoter. We measured output fluorescence intensity at regular time intervals and we verified that it incresed esponentially. After 90 minutes we eliminated IPTG induction resuspendig the cells in M9 medium with 1M glucose and we verified that fluorescence output intensity decreased quickly to the initial level. | ||
| + | We could not measure fluorescence output intensity of cells in 8mM IPTG at 140 minutes because cells died. | ||
| + | |||
| + | Our device seems to work as expected like a switch as the mathematical model predicted. | ||
| + | |||
| + | |||
| + | |||
| + | [[Image:curvetempi2.jpg|center]] | ||
| + | =Concluding Remarks= | ||
| - | + | Although our preliminary results on the intermediates are consistent with the design of the device, a lot of work still remains to be done in order to obtain a functional Genetic Schmitt Trigger. | |
| + | We need to characterize the effect of LacY permease gene insertion downstream of the pLac promoter. [http://partsregistry.org/Part:BBa_I763032:Experience Preliminary tests] on this part showed that we cannot have a full control of LacY expression after IPTG induction. | ||
| + | Complete biodevice includes LacI gene under the control of pTet promoter in order to have a sufficient production of the repressor that should fully inhibit pLac transcription. Our results on the intermediate pTet promoter might jeopardize this choice. | ||
| + | So, we need to reproduce our experiments and to add this aspect in the model in order to verify that hysteresis persists. | ||
| + | Working for Igem has been a great experience and we want to go on with our project. This competition represented for us a good chance to explore the paradigma of Synthetic Biology. | ||
| - | = | + | =Acknowledgements= |
Our Team was funded by: | Our Team was funded by: | ||
| Line 626: | Line 649: | ||
::1. [[Bologna_University/Procedure | Procedure]] | ::1. [[Bologna_University/Procedure | Procedure]] | ||
::2. [[Bologna_University/Protocols | Protocols]] | ::2. [[Bologna_University/Protocols | Protocols]] | ||
| - | ::3. [[Bologna# | + | ::3. [[Bologna#Image Acquisition System | Microscopy: Experimental SetUp]] |
| - | ::4. [[Bologna#Image | + | ::4. [[Bologna#Image Acquisition | Image Acquisition and Analysis]] |
:'''[[Bologna_University/Literature | Literature]]''' | :'''[[Bologna_University/Literature | Literature]]''' | ||
| Line 637: | Line 660: | ||
::2. [[Bologna_University#Fluorescence intensity dependence on Promoter type | Fluorescence reliance on Promoter and Medium]] | ::2. [[Bologna_University#Fluorescence intensity dependence on Promoter type | Fluorescence reliance on Promoter and Medium]] | ||
::3. [[#Components Characterization | Components Characterization]] | ::3. [[#Components Characterization | Components Characterization]] | ||
| - | :[[# | + | :[[#Concluding Remarks | '''Concluding Remarks''']] |
|- | |- | ||
|} | |} | ||
Latest revision as of 21:23, 26 October 2007
"Ὁ βίος βραχὺς, ἡ δὲ τέχνη μακρὴ, ὁ δὲ καιρὸς ὀξὺς, ἡ δὲ πεῖρα σφαλερὴ, ἡ δὲ κρίσις χαλεπή"
"Vita brevis, ars longa, occasio praeceps, experimentum periculosum, iudicium difficile"
"Art is long, life is short, opportunity is fleeting, experience is deceitful, judgement is difficult"
"La vita è breve, l'arte è lunga, l'occasione fuggevole, l'esperimento pericoloso, il giudizio difficile"
(Aforisma di Ippocrate di Coo)
Contents |
About Us
Welcome to Bologna’s IGEM Wiki!
Our team: Francesca Buganè, Michela Mirri, Francesco Pasqualini, and Silvia Tamarri, all undergraduate students in Biomedical Engineering; Guido Costa, undergraduate student in Electronic Engineering; Iros Barozzi, undergraduate student in Industrial Biotechnology and Bioinformatics and Alice Pasini, PhD student in Biochemistry.
We are advised by: [http://www.ing2.unibo.it/Ingegneria+Cesena/Strumenti+del+Portale/Cerca/paginaWebDocente.htm?NRMODE=Published&TabControl1=TabContatti&UPN=emanuele.giordano%40unibo.it Dr Emanuele Giordano], Lecturer in Biochemistry and [http://www-micro.deis.unibo.it/cgi-bin/user?tartagni Prof. Marco Tartagni], Professor of Electronics. We are grateful to our advisors for their time and support!
Our instructors are: [http://www.ing2.unibo.it/Ingegneria%20Cesena/Strumenti%20del%20Portale/Cerca/paginaWebDocente?UPN=silvio.cavalcanti@unibo.it Prof. Silvio Cavalcanti], Professor of Bioengineering; Francesca Ceroni, BiotechD and [http://www-micrel.deis.unibo.it/~christine/ Christine Nardini], PhD in Electronic Engineering .
Our Project
Introduction
Our goal is the realization of a genetic circuit able to implement the functionality typical of an electronic device called Schmitt Trigger (as defined by its inventor [http://www.otto-schmitt.org/ Dr Otto H. Schmitt]).
Pardon me, what do you mean? (AKA Functional Requirements)
The main feature of this device is to be a “smart” switch: that means a switch with memory.
In a "stupid" switch when the input (some environmental condition) crosses a certain threshold the output (some switch properties) changes, for instance from on to off. Often the environmental change is the quantitative modification of the value that describes the environment (temperature, pressure, pH, ect). The "stupid" device switches just for a given value of the input (threshold).
Figure1.The "stupid" switch.
So far so good, however, if the switch input has a value that continually even minimally changes across the threshold, the device will keep going on and off, wasting energy and leaving the system in an unstable state.
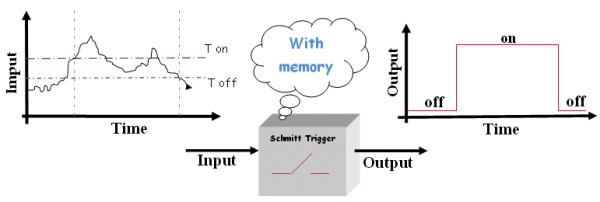
To avoid all this we need a “smart” switch. Basically, this device switches on or off at two different thresholds (High and Low thresholds called Ton and Toff respectively) depending on the history of the system. So, according to the state of the device, the threshold for switching will change.
Figure2.The "smart" switch.
This kind of "smart” switch, the "Schmitt Switch", is largely used in technical applications since it overcomes the instability issue; in fact, the minimal variation able to cause a change in the output must be as large as the difference between the two thresholds. Then noise becomes not so critical.
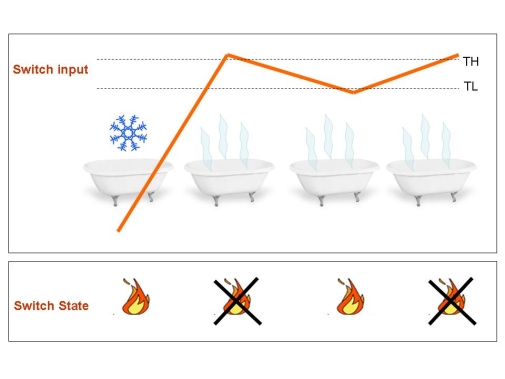
Figure 3.Typical application of the Schmitt Trigger: The boiler. Once the water temperature passes the higher threshold, boiler turn off until temperature crosses the lower threshold. Since this system work in closed loop (temperature controls the heater that determines the temperature), it is able to automatically maintain a warm temperature: the temperature holds stable and so does your mood if you are in the bath tub.
The reason why the “smart” switch works that well is due to its [http://en.wikipedia.org/wiki/Hysteresis hysteresis] properties.
Our genetic circuit aims to reproduce this fundamental property of Schmitt Trigger.
How? (AKA Technical Requirements)
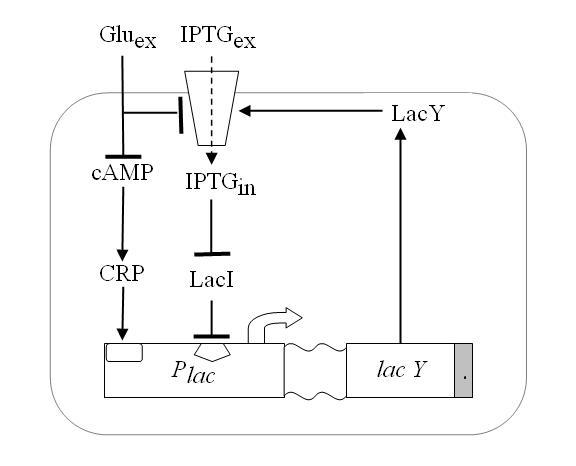
To do it we exploited one of such genetic systems, existing in the complex of genes that form the Lac Operon shown in Figure 4.
Namely, E. coli can survive by metabolizing either glucose or lactose - in the case of lack of glucose. Lactose- or glucose-metabolizing modes are the two stable state of the system. To perform experiments we use IPTG a structural analog of lactose that cannot be metabolized. Thus the input of our system are the external concentrations of Glucose and IPTG (Gluex and IPTGex respectively).
Since lactose metabolism is more energy consuming, usually all the apparatus that takes care of the lactose metabolism is repressed. It is [http://en.wikipedia.org/wiki/Lac_operon the promoter pLac ] constitutively shut off by the presence of the LacI protein, that inhibits the transcription of the downstream genes in the operon ([http://bcs.whfreeman.com/mga2e/pages/bcs-main.asp?s=132&n=003&i=283&v=&o=&ns=0&uid=0&rau=0 this] is how it works). When IPTG is in the environment, several concurrent processes take place in the cell. IPTG flows across the membrane and after some processing it is able to quench the repressor LacI, thus allowing the transcription of lacY gene that in turn enhances IPTG uptake and increases its action on the repressor LacI. This represents the positive feedback loop we need.
Figure 4. Schematic overview of the Lac operon.
As it is the system can already perform like a Schmitt trigger, for certain values of the inputs. However there is another mechanism that allows the fine tuning of the system: glucose has a double action both on a molecule called cAMP that it bounds to, inhibiting its action on pLac-driven gene expression (catabolite repression) and on the lactose, since it reduces its uptake (inducer exclusion).
What for?(AKA Applications)
We figured that such a system could be useful for two main purposes.
1. Controlled Gene Expression Trigger
Manipulating gene expression using most of the current protocols in molecular biology usually relay either on a strong overexpression of a protein or on its total silencing. Once induced, both these two extreme perturbations are generally unmodifiable (so that this approaches, although shedding light on the general role of the candidate gene, are rough indicators of the effect of its real physiological transcriptional level). Our genetic device can limit these drawbacks offering 1) a controlled on-off transition of the protein expression at will (by dosing the extracellular IPTG input) and 2) its graded transcriptional level (playing with the extracellular Glucose concentration), representing a powerful tool for biologists. Moreover, in addition to the ability to control the timing and the extent of the induction, our device has the additional advantage to guarantee that small changes in the extracellular concentration of the inducer IPTG would not affect the stability of the level of the gene expression.
2. Glucose Sensor
A second application takes advantage of the external glucose dependence. In fact, we know that the expression of the system is stable, but its intensity depends on the glucose. We can reverse the perspective and observe the intensity of the expression to infer the abundance of glucose in the medium.
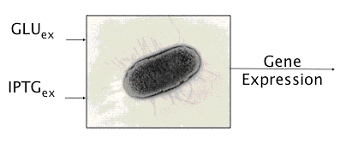
Figure 5. Schematic view of our device
Mathematical Model
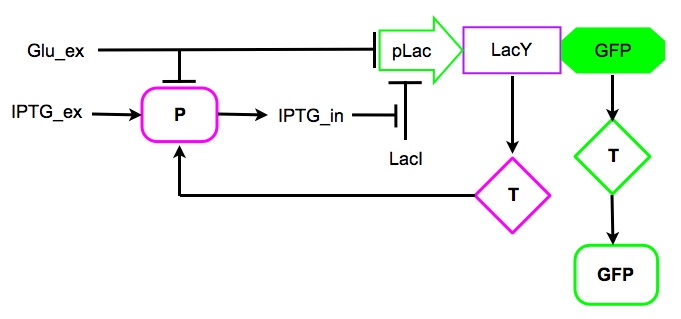
Based on the our knowledge on the [http://en.wikipedia.org/wiki/Lac_operon Lac operon] and on the works of Santillàn et al. (2004, 2007), we decided to explore the behavior of a possible synthetic circuit which mimics the genetic circuit by modeling the parts depicted in Figure 6.
Figure 6. The core of the synthetic circuit as modelled in the subsequent equations. P and T represent the Protein and the Transcript of the corresponding genes.
Model Equations
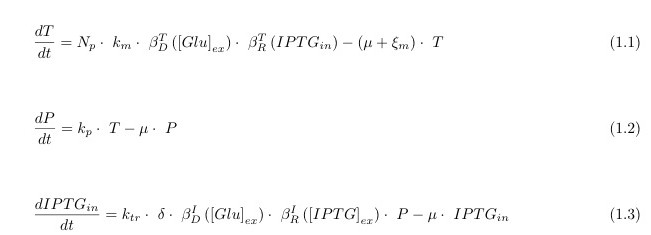
Let’s start with the state model equations. They represent the variation over time (derivative d/dt) of the intracellular level (in molecules per bacterium, mpb) of:
- 1. the transcript of lacY (T);
- 2. the membrane permease coded by LacY (P)
- 3. IPTG: this is an artificial Lactose equivalent that is un-metabolizable by the cell. This allows us to neglect the effects of the other genomic Lac Operon Genes.
These equations are sufficient to model the dynamics relevant to the functioning of the system and nor overly complex, to avoid biologist melancholy.
The inputs of this system are the extracellular concentrations of Glucose and IPTG, that are processed by the non linear functions described in the table below.
| | Glucose Dependent LacY Transcription Inhibitor | Plot |
|---|---|---|
| | IPTG Dependent LacY Transcription Enhancer | Plot |
| | Glucose Dependent IPTG Uptake Inhibitor | Plot |
| | IPTG Dependent IPTG Uptake Enhancer | Plot |
and have their own formulas and trends.
Since our output is the reporter protein GFP we need another equation to link the protein LacY (P) to GFP: in first approximation, we simply assume:
All the genomic parameters (from Santillàn et al, 2007) are defined here, while the parameters adopted to model the synthetic parts are defined in the table of Synthetic Parameters.
Numerical Simulation
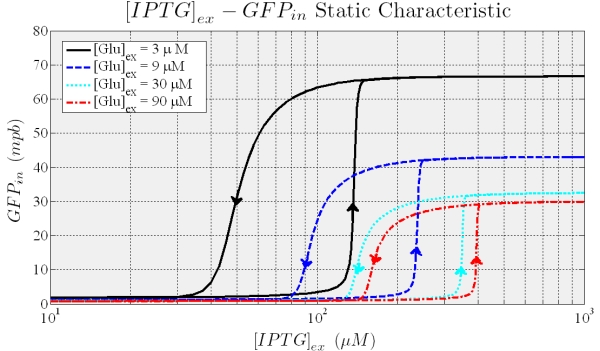
To analyse the circuit’s behaviour under different stimulations we implemented model equations in simulink (Mathworks). As model input we impose a periodic change in the extracellular IPTG levels (slow enough to assume that the system is near to the equilibrium for each IPTG value) while Glucose is kept constant. Several simulations were run by assigning a different value to Glucose. The results are shown in Figure 7: the system shows hysteresis, distinct thresholds depending on the Glucose and, once induced, constant level of expression. Notably, the circuit shows bistability (two stable equilibria) for IPTG values between the thresholds.
Figure 7. Shows the typical hysteresis profile, different curves are due to different values of the external Glucose.
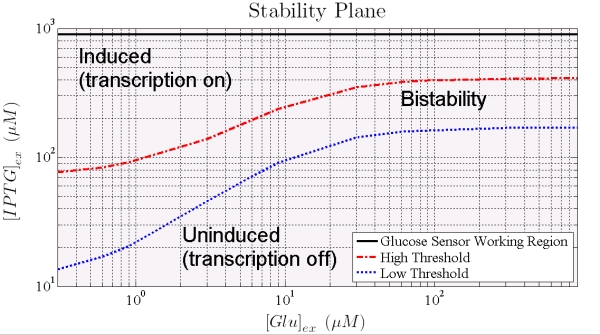
Dependence of IPTG thresholds on Glucose are shown in Figure 8: the points that lie between the thresholds are values (of the inputs) at which the system exhibit bistability; that is, we are not able of predict the final state with no information on the initial state. Outside these values, system reaches without any doubts, steady induced or uninduced state.
Figure 8. Shows how the 2 thresholds value changes for varying levels of external glucose. All the points that lie between the two curves represent states for which the trascription can occur or not, the points below the blue curve correspond to pLac full repression (trascription off) while points over the red curve correpond to a condition where Plac is partially repressed (trascription on).
When the higher threshold is crossed transcripion takes place with an expression level unsensitive to the ITPG stimulus (see Figure 7). In this condition (i.e. IPTG 900 microM), the saturation level depends on the Glucose (see figure 8), and the circuit acts like a glucose sensor.
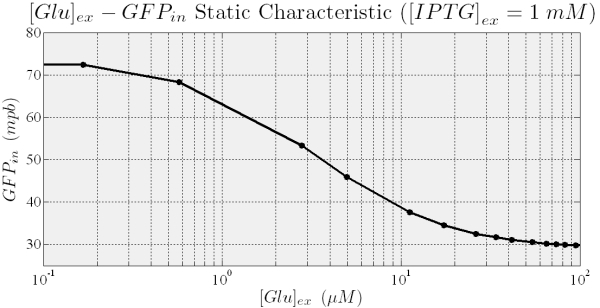
Figure 9.Shows that the final level of GFP concentration (output of the system) in the fully induced steady state depends on the External Glucose.
In conclusion, numerical simulation predicts a circuit functionality which is coherent with our initial speculation, i.e. the circuit presented in Figure 6 can operate like a Schmitt Trigger.
The values of few parameters were assigned with some uncertainty. In particular, we used a value of LacI that is about 30 times the genomic one for a circuit copy number of 10. Since these values can affect the model prediction we will perform specific experiment to identify this parameters. However, the LacI values was incresed in order to trigger off the system for low values of IPTG. To realize this increase we decided to build a sub-circuit where the LacI gene is under the control of pTet promoter.
At the same way, the GFP steady state expression decreases with extracellular Glucose (see Figure 9), while we want, for an intuitive use of the sensor a fluorescent signal that increases with Glucose. To obtain this behavior we plan to build a sub-circuit that acts like an inverter, with an RFP under the control of pλ, and to put in the main circuit the cI gene which encode for the protein that regulates pλ.
Image Acquisition and Analysis
Image Acquisition System
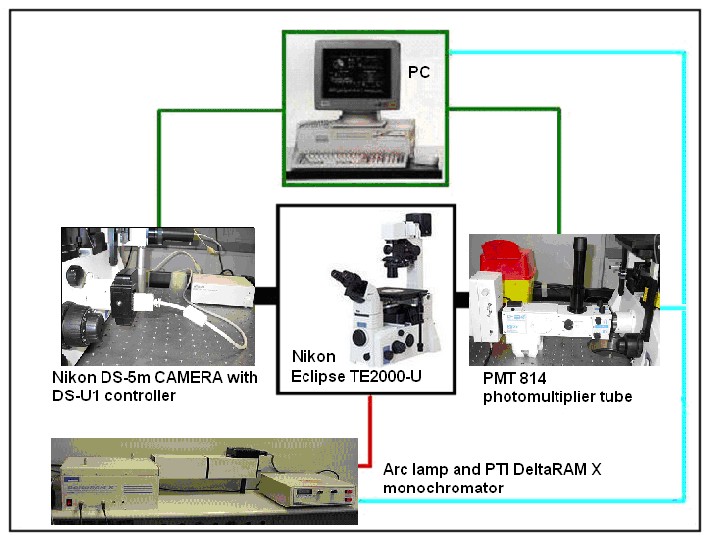
Figure 10. Image acquisition system based on the fluorescence microscope.
For complete description of Acquisition System, see here.
Image Acquisition
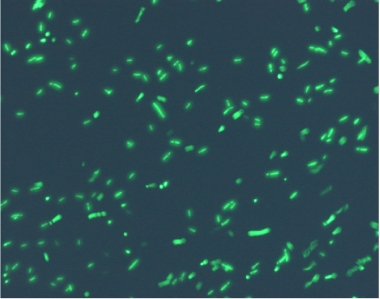
Using the experimental set up, we obtain short movies of fluorescent bacteria; then we extract several frames from each of them, using a dedicated software. Example images are shown below.
Figure 11.Fluorescent bacteria
Image Elaboration
Since we need to know how much of the total image area is occupied by bacteria, we process the images with a segmentation algorithm implemented in Matlab.
Here are the processing phases:
- the RGB image is read and the green channel is extracted;
- a morphological top hat filtering is performed on the grayscale image;
- by means of an adaptive threshold, the image is tranformed in a binary one;
- the distance between every point and the nearest black pixel is calculated;
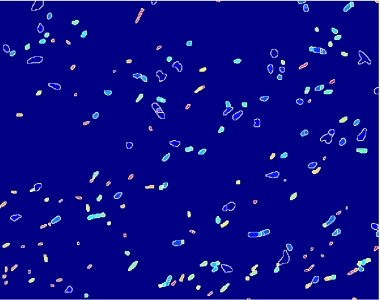
- on this last image the [http://en.wikipedia.org/wiki/Watershed_%28algorithm%29 watershed] algorithm is applied: every pixel is assigned a label, depending on the segmentated region it belongs; then, every labeled region is represented with a different colour, as in the images shown below;
Figure 12.Algorithm output.
- the area of every segmented region is calculated, checking that the summation of these areas (including the background) balances the image total area;
- two complementary matrices are created:
1) ImageWithOutBackground, containing the intensity positive values corresponding only to pixels recognised as bacteria, with zeros elsewhere;
2) ImageBackground, which contains the intensity positive values of pixels recognised as background, with zeros as other entries;
- with a summation over all the ImageWithOutBackground matrix' entries, the total intensity is obtained;
- dividing this value by the total bacteria area, the output is the normalized intensity we use to compare the fluorescence of different kinds of bacteria.
This image acquisition and elaboration protocol has been validated with a series of measures. For the results, see here.
Thanks to Camilo Melani for his competence and kindness during the algorithm implementation.
Biodevice
Components
The Genetic Schmitt Trigger [http://partsregistry.org/Part:BBa_I763029 (I763029)], built up with iGEM 2007 Biobricks, consists of 3 main parts combined in the same plasmid: pTeTR-LacI [http://partsregistry.org/Part:BBa_I763026 (I763026)], pLac-cI-LacY-GFP [http://partsregistry.org/Part:BBa_I763019 (I763019)], pλ-RFP [http://partsregistry.org/Part:BBa_I763007 (I763007)].
Each part displays a specific function depending on the promoter and the coded gene(s).
Figure 13: The Genetic Schmitt Trigger biodevice ([http://partsregistry.org/Part:BBa_I763029 I763029]).
- 1.pTetR-LacI [http://partsregistry.org/Part:BBa_I763026 (I763026)] codes for LacI gene [http://partsregistry.org/Part:BBa_C0012 (C0012)] regulated by pTetR [http://partsregistry.org/Part:BBa_R0040 (R0040)] inverting promoter. pTetR can be considered a constitutive promoter in absence of tetracycline (or its analog aTc). Its action is inhibited by the addition of this antibiotic. This promoter regulates the expression of LacI gene whose protein inhibits the activation of pLac promoter. This part is important to make up for endogenous LacI and to prevent pLac activation in absence of induction with lactose or IPTG.
- 2.pLac-cI-LacY-GFP [http://partsregistry.org/Part:BBa_I763019 (I763019)]: LacY permease [http://partsregistry.org/Part:BBa_J22101 (J22101)] controlled by pLac promoter [http://partsregistry.org/Part:BBa_R0010 (R0010)] introduces a positive feedback necessary for hysteresis. LacY is a membrane transporter allowing the uptake of lactose (or IPTG) in the cell. Lactose (or IPTG) on his own, causes the LacI repressor release from pLac operators. At the same time GFP proteins [http://partsregistry.org/Part:BBa_J04031 (J04031)] are produced as reporters of the induction. We also introduced the gene for cI repressor [http://partsregistry.org/Part:BBa_C0051 (C0051)] that binds to the cI regulator [http://partsregistry.org/Part:BBa_R0051 (R0051)] and inhibits its action.
- 3.pλ-RFP [http://partsregistry.org/Part:BBa_I763007 (I763007)] acts as reporter of standard condition. Pλ promoter [http://partsregistry.org/Part:BBa_R0051 (R0051)] is a constitutive promoter from phage-λ. Here it regulates RFP protein [http://partsregistry.org/Part:BBa_E1010 (E1010)] expression and it is inhibited by cI repressor [http://partsregistry.org/Part:BBa_C0051 (C0051)]. So, when external glucose is high, pLac transcription level, cI and GFP production are high, while RFP production is low. When external glucose is low pLac transcription level, cI and GFP production are low while RFP production is high. As a consequence, we can consider RFP fluorescence levels as an indicator of glucose concentration in culture medium.
How it works
In standard conditions, without IPTG induction pLac promoter is repressed by the LacI repressor binding on the operator sites and cI, LacY and GFP proteins are not expressed. In this condition pλ promoter is active and RFP is expressed. The cells show red fluorescence.
Figure 14: Project in action: no IPTG in the medium.
For induction IPTG is added in the culture medium. Due to inductor binding to LacI repressor, Plac promoter is activated and cI, LacY and GFP genes are expressed. In this condition pλ promoter is repressed by cI inhibitor and so RFP is not expressed. The cells show green fluorescence.
Figure 15: Project in action: IPTG in the medium.
Intermediates
The table below shows all the intermediates that we have obtained to build up our final device. For each part you can find:
-in the first column the link to the Registry;
-in the second column the components for each part;
-in the third column the plasmid the part has been cloned in;
-in the fourth the insert length after double digestion with Xba1/Pst1 enzymes linked to the electrophoresis gel run;
-in the fifth column cell vitality after transformation;
-in the sixth column fluo data for each part.
| Igem Code | Fragment | Plasmid | Length (bp) | Vitality | Fluo | |
|
|
|
|
|
Clicking on the length of the fragment you will be shown the electrophoresis gel of the digestion of the fragment excised from the plasmid by cutting it with a double digestion using Xba and Pst1 enzymes.
Components Characterization
Fluorescence intensity dependence on Promoter type
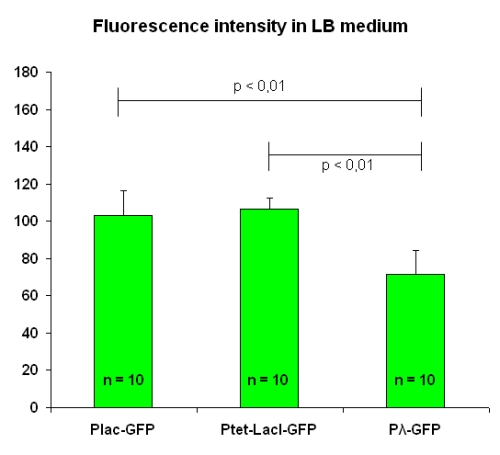
The three promoters used in the biodevice ([http://partsregistry.org/Part:BBa_I763004 I763004], [http://partsregistry.org/Part:BBa_I763035 I763035] and [http://partsregistry.org/Part:BBa_I763011 I763011]) have been separately characterized in order to gain useful information for the model. We chose to characterize the behavior of promoters escluding the LacY positive feedback.
First, the three different intermediate parts have been tested in LB medium to stabilish differences in transcription rates. All of the three intermediates have GFP protein as a reporter to avoid difference in protein synthetis and degradation.
Mesuarements have been performed at OD value of 1.2. We have taken pictures of two fields from each of the five slides we prepared; then, we calculated the mean value for each slide and finally the mean and the standard deviation on these values. Results are in figure below:
Fluorescence intensity levels for [http://partsregistry.org/Part:BBa_I763004 I763004] and [http://partsregistry.org/Part:BBa_I763035 I763035] are similar, while [http://partsregistry.org/Part:BBa_I763011 I763011] beams a significantely lower fluorescence (30%).
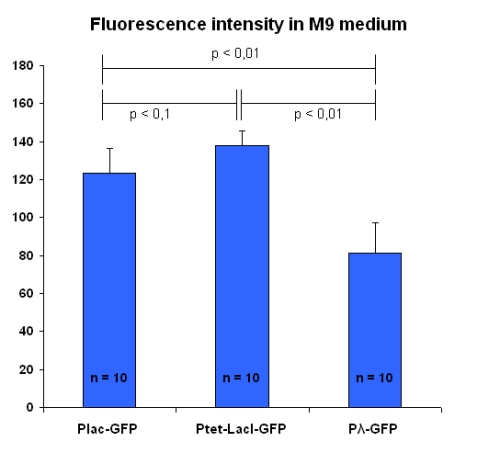
Experiments have been repeated with bacteria grown into a different culture medium (M9 medium), that is the one chosen for testing the Genetic Schmitt Trigger.
Results are in figure below:
In this case, the three promoters produce levels of fluorescence significantely different being pTet the one with the highest transcription activity.
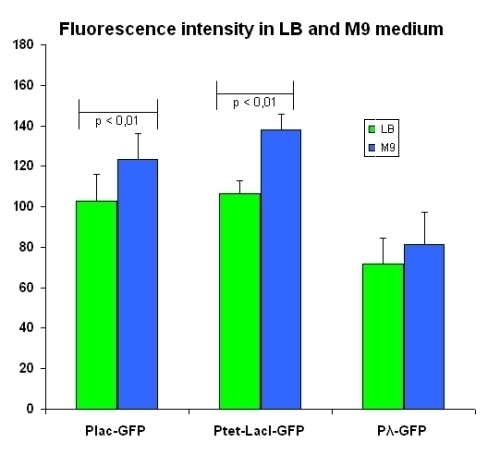
Comparison between fluorescence elicited by the two media
To highlight the differences between the two media, we have directely compared for each intermediate fluorescence intensity in the two media. The comparison is shown in figure below:
pλ promoter seems to not been influenced by the growth in different media. As expected, pLac promoter seems to have a higher transcription rate in a medium not added with carbon sources (M9 minimal medium). This result strictly agree with the prediction obtained by our mathematical model (20% experimental vs 23% simulation). Surprisingly, pTet promoter increases its activity changing the medium. We are not able to justify this result. Anyway, our mathematical model does not include such dependence and this aspect deserve to be investigated to be clarified.
Complete data set, summarized in the table below, is here.
| LB | M9 | ||
|---|---|---|---|
| I763004 | pLac-GFP | 102.9 ± 13.4 | 123.2 ± 13.1 |
| I763035 | pTetR-LacI-GFP | 106.6 ± 6.0 | 138.1 ± 7.7 |
| I763011 | pλ-GFP | 71.6 ± 12.3 | 81.3 ± 13.9 |
Switch Time Course
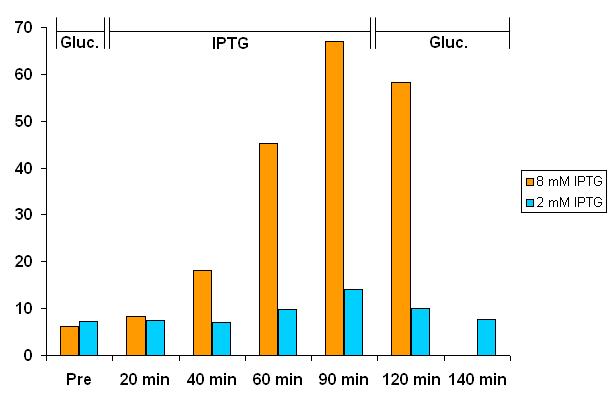
We also tested the intermediate device pTet-LacI-pLac-GFP [http://partsregistry.org/Part:BBa_I763027 (I763027)] in a high copy plasmid [http://partsregistry.org/Part:pSB1A2 pSB1A2] to verify if it really works as a toggle switch.In this intermediate device only LacY is not included since we would study transcriptional activity without the positive feedback due to the lactose permease.
Following the Fluorescence Test protocol, bacteria grew in LB medium O/N. The day after we tested output fluorescence intensity in M9 with 1M glucose. We induced them with two different IPTG concentrations (2mM and 8mM) to activate pLac promoter. We measured output fluorescence intensity at regular time intervals and we verified that it incresed esponentially. After 90 minutes we eliminated IPTG induction resuspendig the cells in M9 medium with 1M glucose and we verified that fluorescence output intensity decreased quickly to the initial level. We could not measure fluorescence output intensity of cells in 8mM IPTG at 140 minutes because cells died.
Our device seems to work as expected like a switch as the mathematical model predicted.
Concluding Remarks
Although our preliminary results on the intermediates are consistent with the design of the device, a lot of work still remains to be done in order to obtain a functional Genetic Schmitt Trigger.
We need to characterize the effect of LacY permease gene insertion downstream of the pLac promoter. [http://partsregistry.org/Part:BBa_I763032:Experience Preliminary tests] on this part showed that we cannot have a full control of LacY expression after IPTG induction.
Complete biodevice includes LacI gene under the control of pTet promoter in order to have a sufficient production of the repressor that should fully inhibit pLac transcription. Our results on the intermediate pTet promoter might jeopardize this choice. So, we need to reproduce our experiments and to add this aspect in the model in order to verify that hysteresis persists.
Working for Igem has been a great experience and we want to go on with our project. This competition represented for us a good chance to explore the paradigma of Synthetic Biology.
Acknowledgements
Our Team was funded by:
- European Union SYNBIOCOMM project

- Ser.In.Ar. Cesena
- University of Bologna - Cesena Campus
Overview Table
| Our Team | Project Design | Project Results |
|
|
