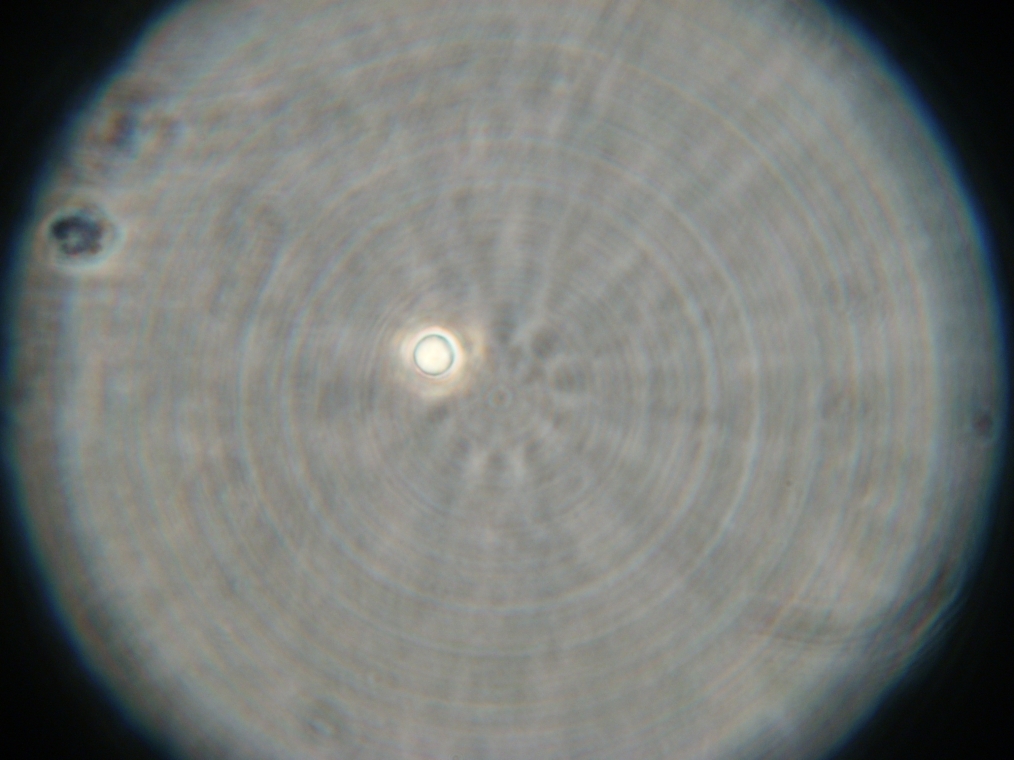
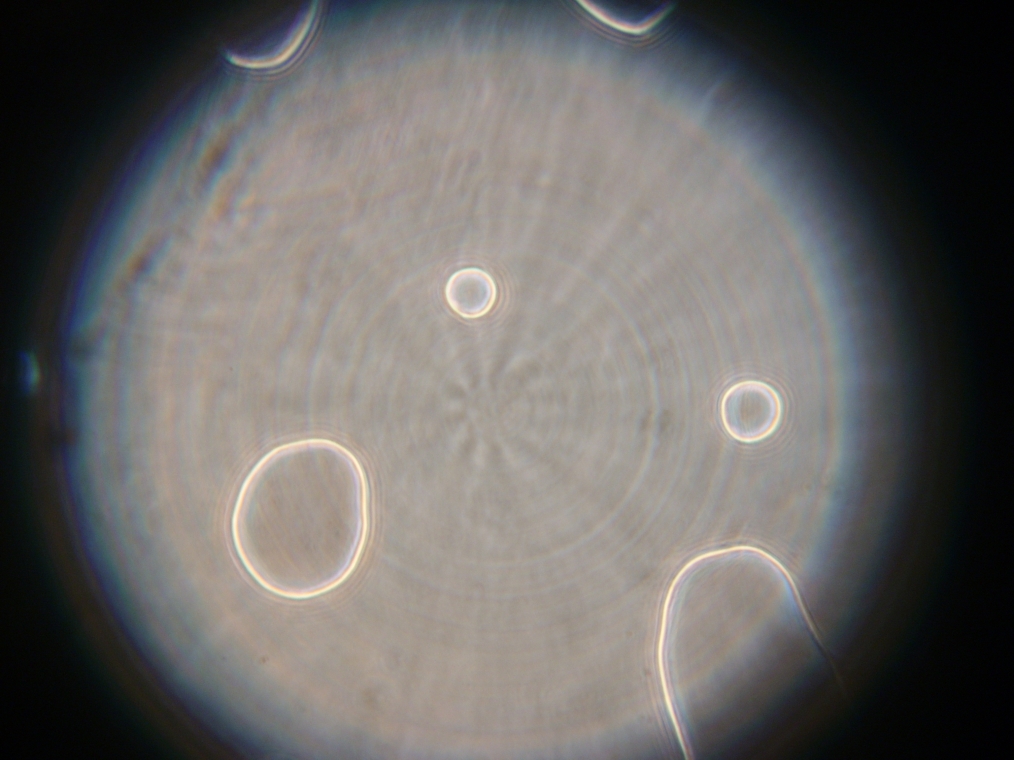
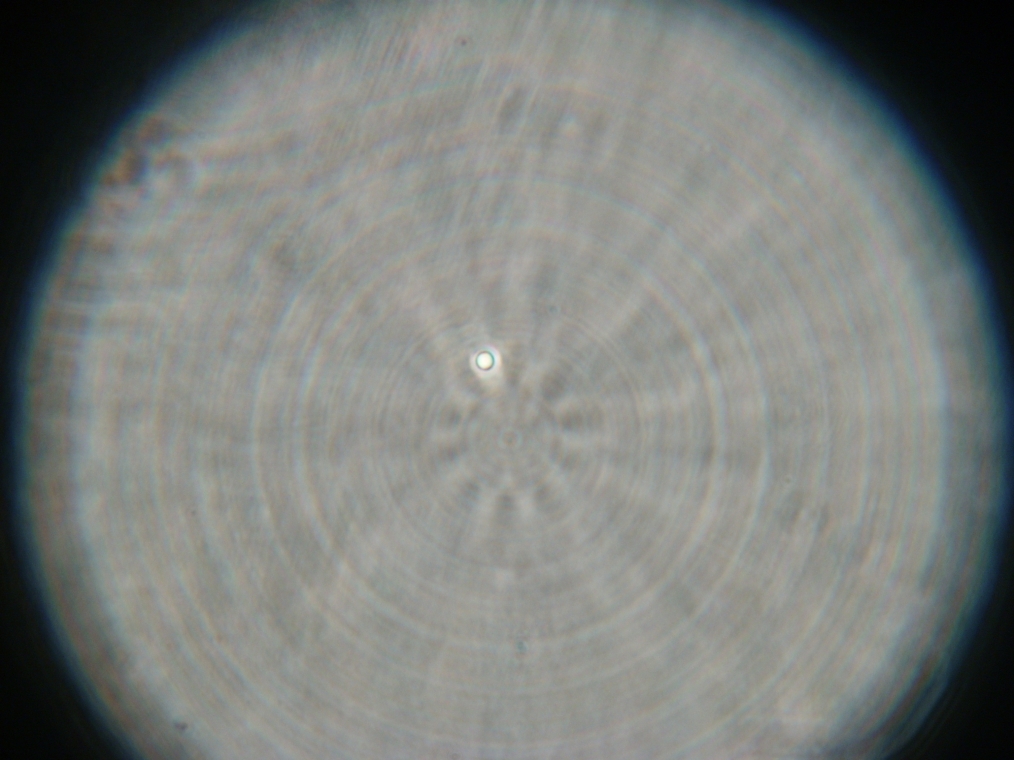
Imperial/Wet Lab/Lab Notebook/2007-09-04
From 2007.igem.org

4 September 2007
Construction of pT7-GFP
- Picked colonies to grow in 5ml LB + Kan
- Cultures left to grow at 37°C overnight
GFP Calibration Curve
More concentrations were carried out for the calibration curve, these give a range of concentrations tested:
- 3.7uM, 1.8uM, 1.uM, 0.5uM, 0.1uM, 0.05uM, 0.025uM, 0.0125uM
The calibration curve can be found [http://www.openwetware.org/wiki/IGEM:IMPERIAL/2007/Experimental_Design/Phase2/Results_1.2 Here]
Vesicles
Formation of Vesicles
2160μl of Solution A-CE was prepared with the following components:
- 583μl of S30 cell extract (home made)
- 1080μl of cell extract buffer
- 36μl of rNTP solution
- 112μl of Pyruvate Kinase solution
- 349μl of ddH2O
360μl of Solution B-CE was prepared with the following components:
- 351μl of Solution A-CE
- 4μl of GFP solution
- 5μl of DNA solution (Ptet with GFP)
The remaining 1.8ml of Solution A-CE was then diluted 10x to form 18ml of Solution A-CEd
The following 3 emulsions were prepared:
- 50μl of Solution B-CE into 8ml of POPC/dodecane suspension
- 50μl of Solution B-CE into 8ml of DOPC/dodecane suspension
- 250μl of Solution B-CE into 47,8ml of POPC/dodecane suspension
11 samples were created in total (note there is no Sample 9):
- Sample Noireaux: Produced from the [http://www.openwetware.org/wiki/IGEM:IMPERIAL/2007/Projects/In-Veso/Implementation/Protocol1.3 | Noireaux protocol]. Solution B-CE was added to 200μl taken from the 50ml POPC/dodecane suspension prepared the day before.
- Sample 1: 2ml from the 10ml POPC/dodecane suspension was used to prepare the interface over 3ml of Solution A-CEd. 1ml of emulsion was added 2 hours later, centrifuged at 120x g, and collected.
- Sample 2: 2ml from the 10ml DOPC/dodecane suspension was used to prepare the interface over 3ml of Solution A-CEd. 1ml of emulsion was added 2 hours later, centrifuged at 120x g, and collected.
- Sample 3: Prepared the day before and left overnight before being collected. Sample not centrifuged.
- Sample 4: Prepared the day before and left overnight before being collected. Sample not centrifuged.
- Sample 5: 2ml from the 50ml POPC/dodecane suspension was used to prepare the interface over 3ml of Solution A-CEd. 1ml of emulsion was added 2 hours later, centrifuged at 120x g, and collected.
- Sample 6: 2ml from the 10ml POPC/dodecane emulsion was poured over 3ml of Solution A-CEd (with no prepared interface), and left to rest for 2 hours, before being centrifuged at 120x g for 10 minutes and collected.
- Sample 7: 2ml from the 10ml DOPC/dodecane emulsion was poured over 3ml of Solution A-CEd (with no prepared interface), and left to rest for 2 hours, before being centrifuged at 120x g for 10 minutes and collected.
- Sample 8: 2ml from the 50ml POPC/dodecane emulsion was poured over 3ml of Solution A-CEd (with no prepared interface), and left to rest for 2 hours, before being centrifuged at 120x g for 10 minutes and collected.
- Sample 10: 2ml from the 10ml POPC/dodecane emulsion recycled from the day before was left stirring overnight, and then was poured over 3ml of Solution A (with no prepared interface). It was left to rest for 2 hours before being centrifuged at 120x g for 10 minutes and collected.
- Sample 11: 2ml from the 10ml DOPC/dodecane emulsion recycled from the day before was left stirring overnight, and then was poured over 3ml of Solution A (with no prepared interface). It was left to rest for 2 hours before being centrifuged at 120x g for 10 minutes and collected.
Samples 1-11 were produced using [http://www.openwetware.org/wiki/IGEM:IMPERIAL/2007/Projects/In-Veso/Implementation/Protocol1.2 | protocol 1.2]
Samples 1, 2, 5, 6, 7, 8 were prepared from an interface formed on top of 3ml of Solution A-CEd (see above).
Results
All 11 samples prepared today were scrutinised under the microscope. Here are the results (scroll down to the bottom for images.):
- Sample Noireaux: No vesicles were found. There were lots of GFP aggregates.
- Sample 1: Plenty of vesicles were found, but with very weak fluorescence inside. There were lots of GFP aggregates.
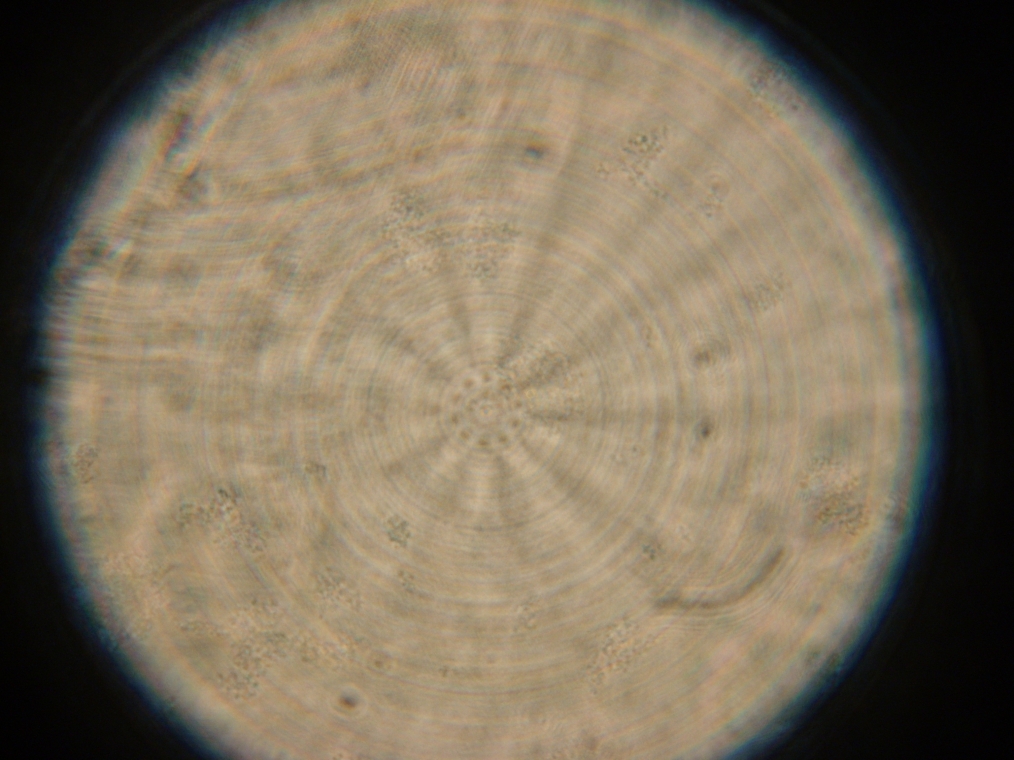
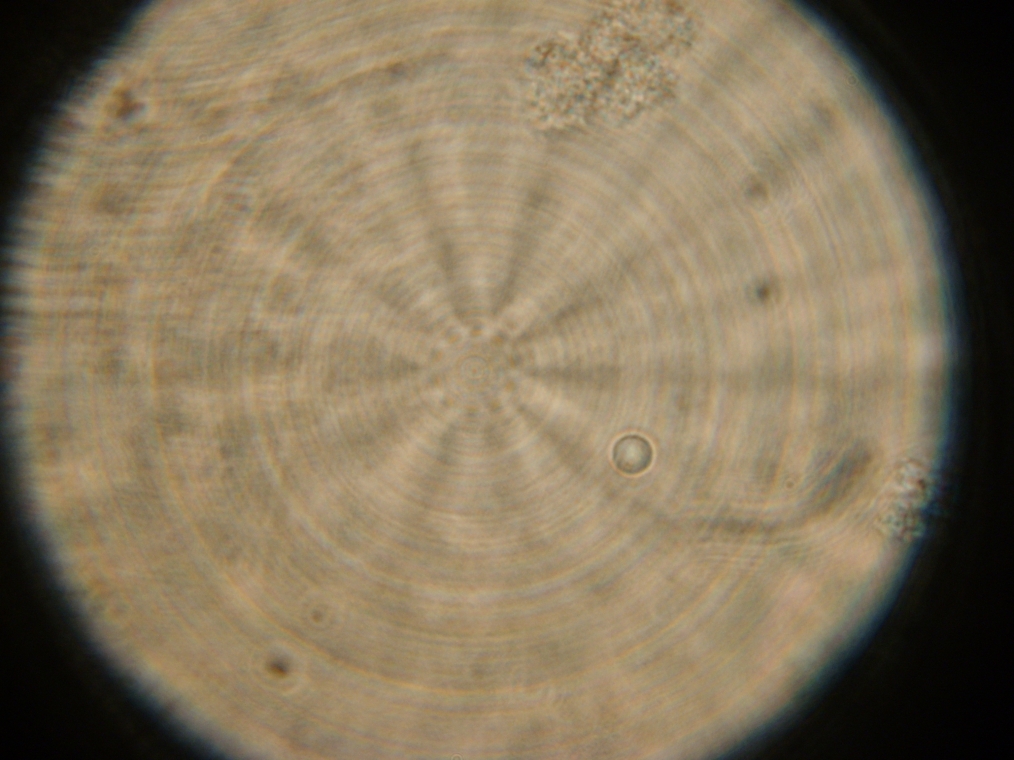
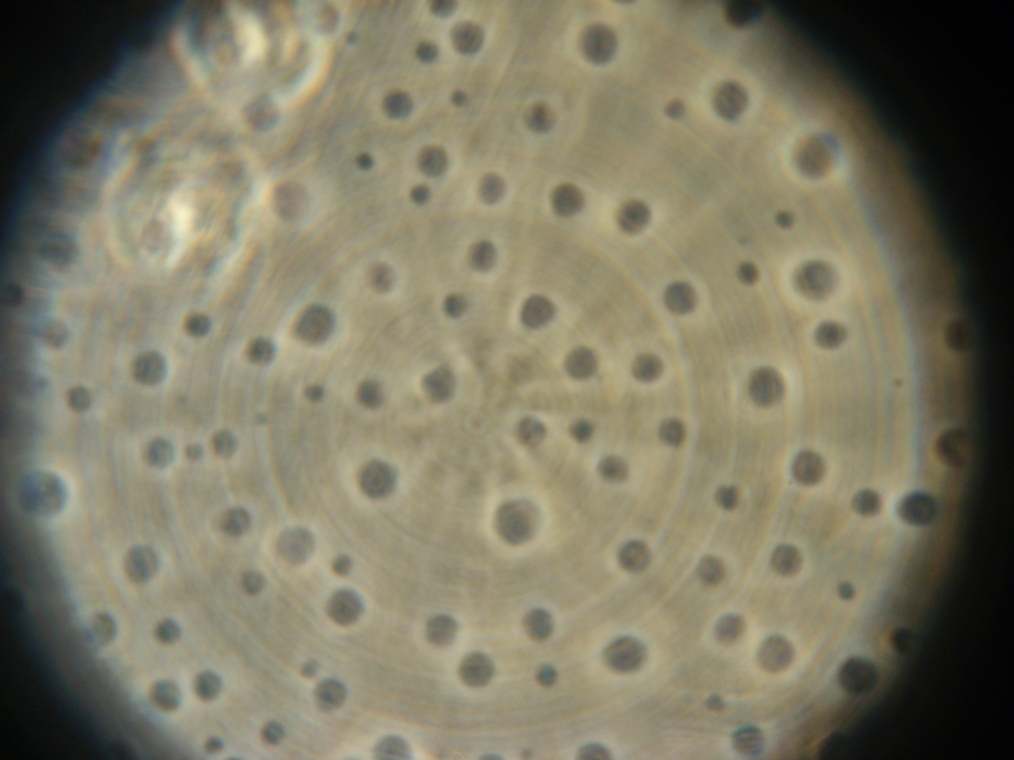
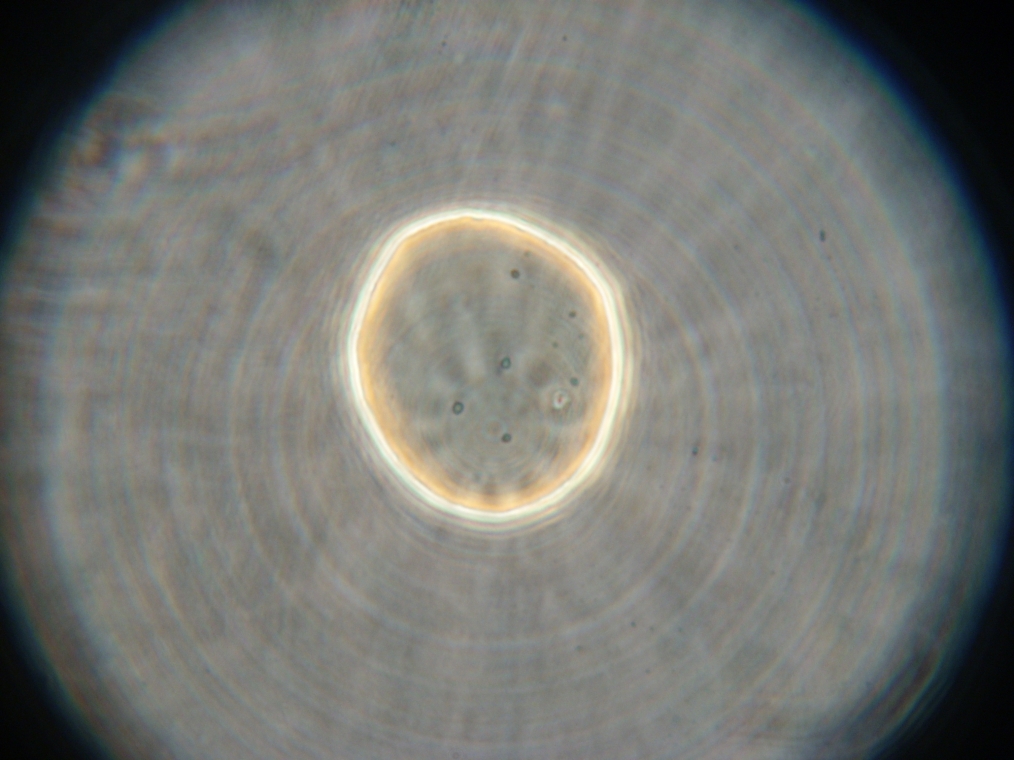
- Sample 2: No vesicles were found, but one large fluorescent blob was present. There were lots of GFP aggregates. A strange, unidentified texture of objects was found.
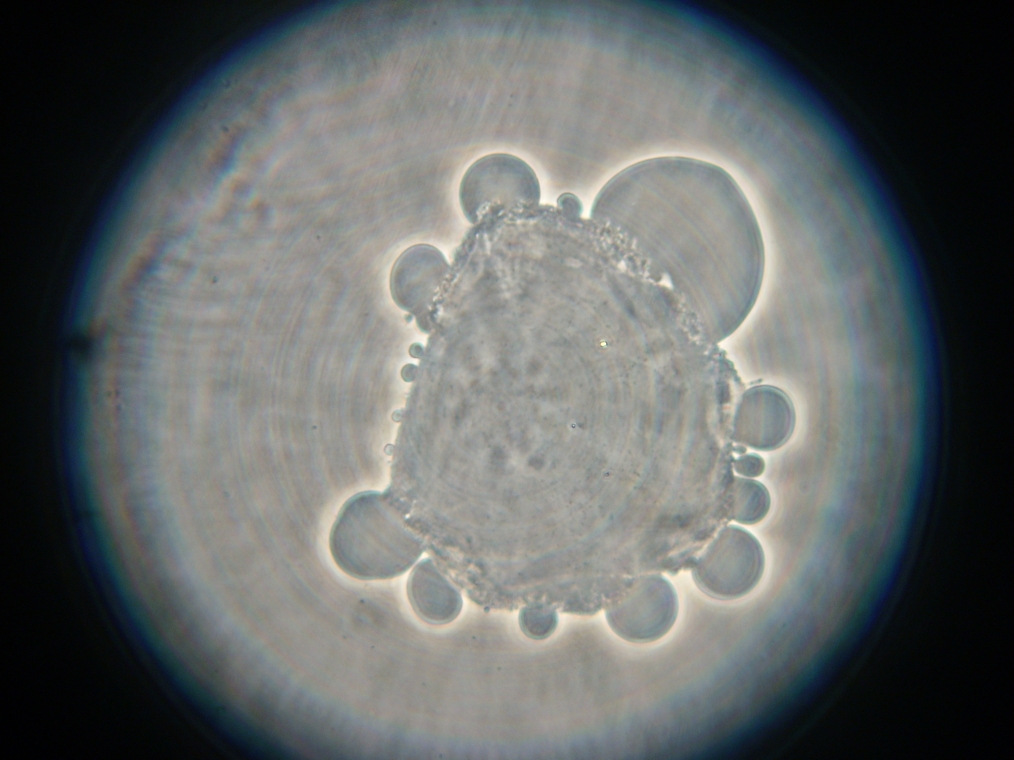
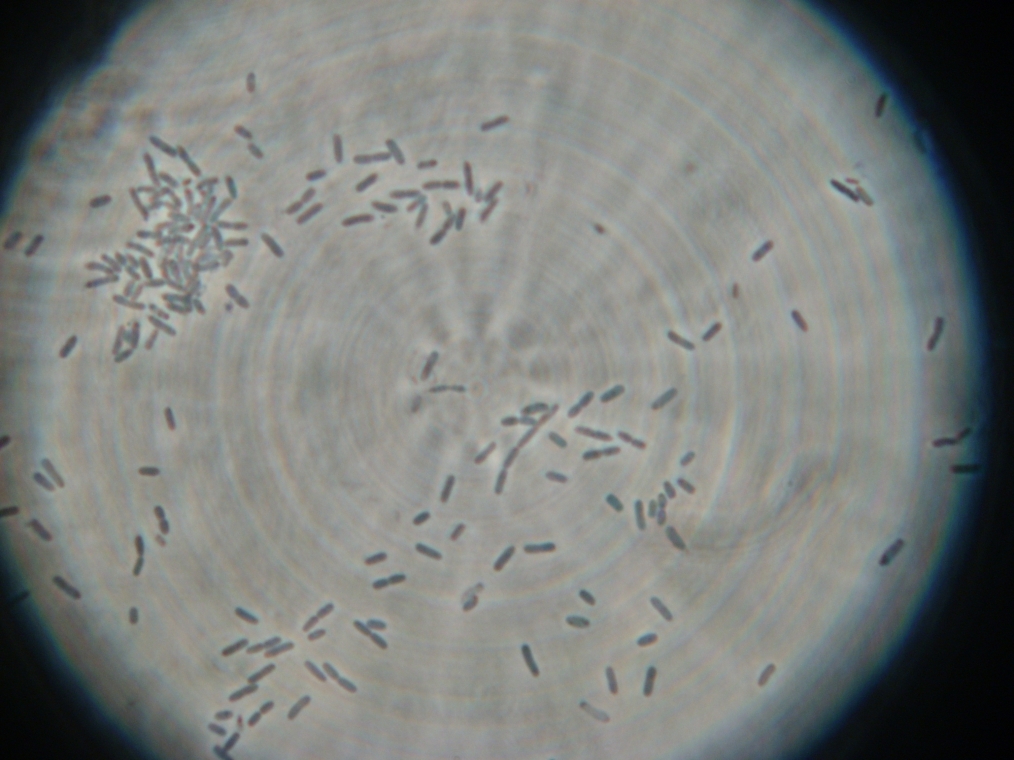
- Sample 3: One possible vesicle or blob found, with no fluorescence inside. E.coli contamination. Strange vesicle coalescence around a large GFP aggregate (vesicles faintly fluorescent).
- Sample 4: Lots of coalescence, with faint fluorescence inside.
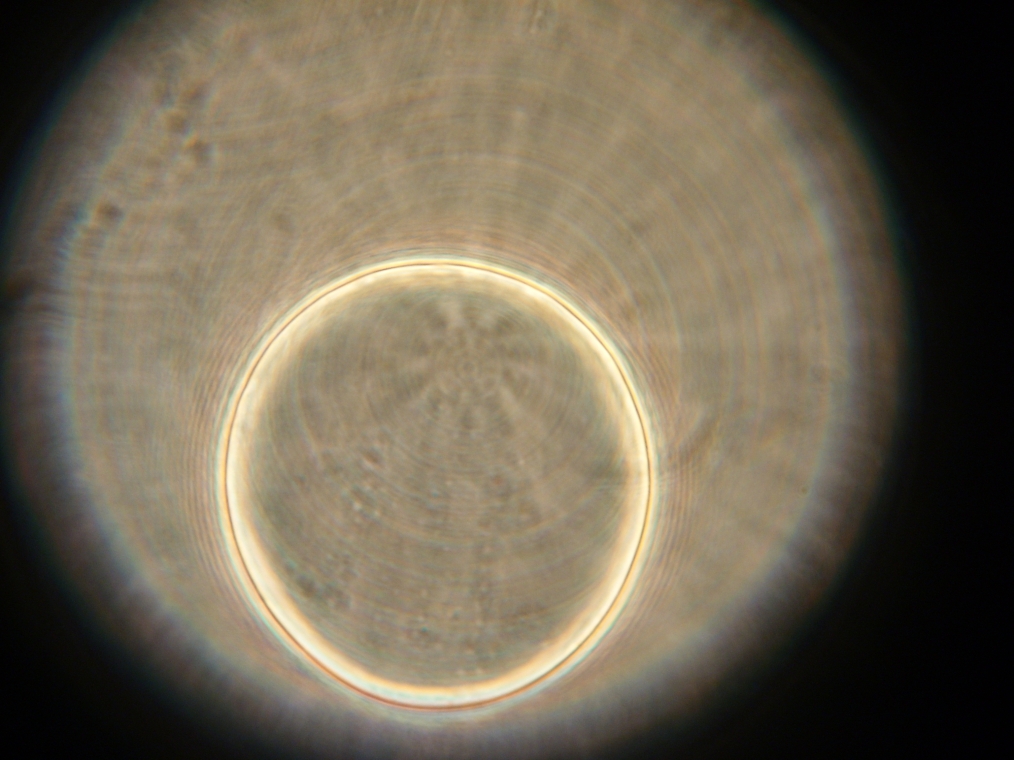
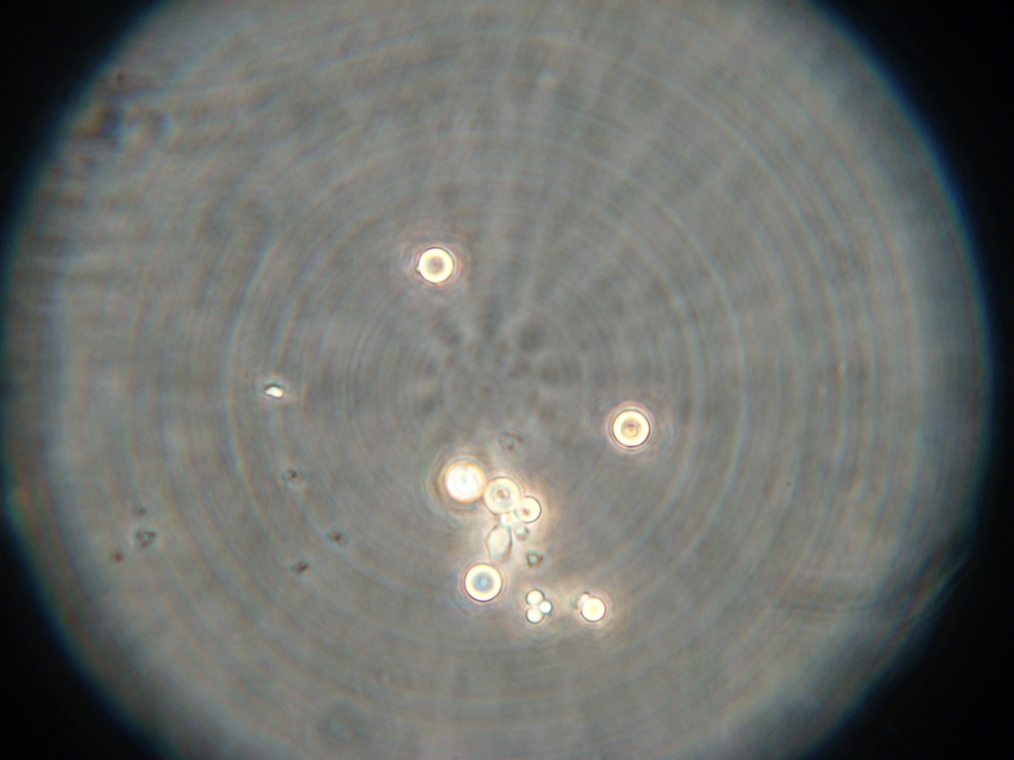
- Sample 5: Flocculated vesicles, with very faint fluorescence inside.
- Sample 6: Well formed vesicles, and some coalescence, with faint and not-so-faint fluorescence inside.
- Sample 7: Rare but well formed vesicles, with faint fluorescence inside.
- Sample 8: Best results. High count of well formed vesicles, with not-so-faint fluorescence inside.
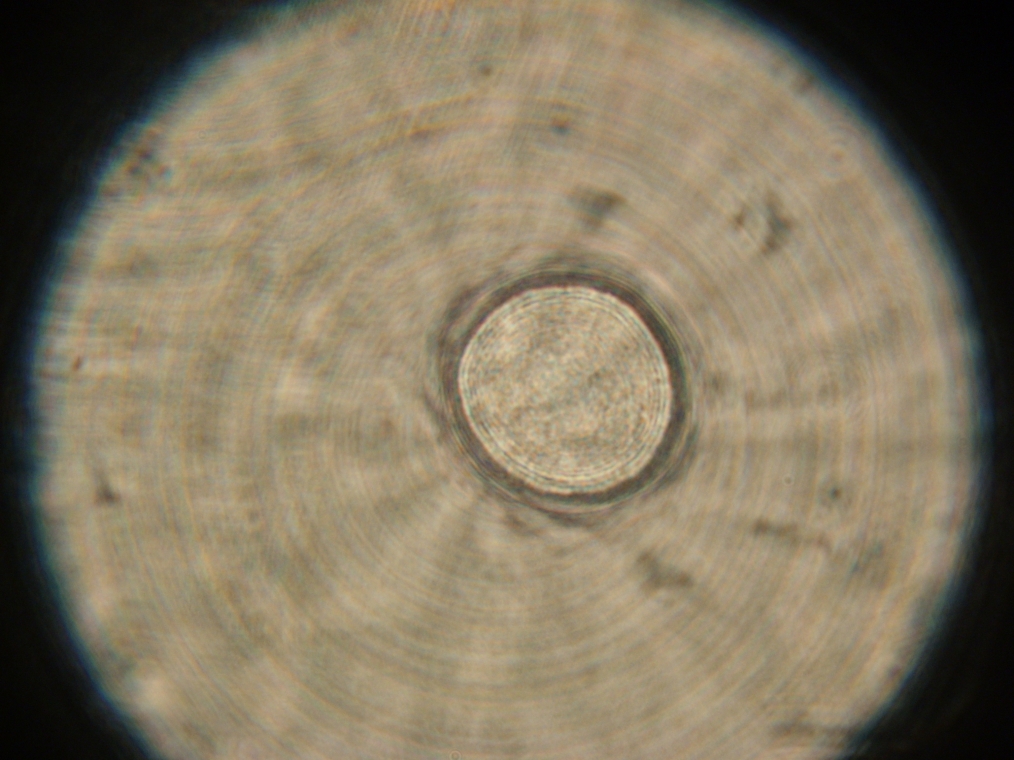
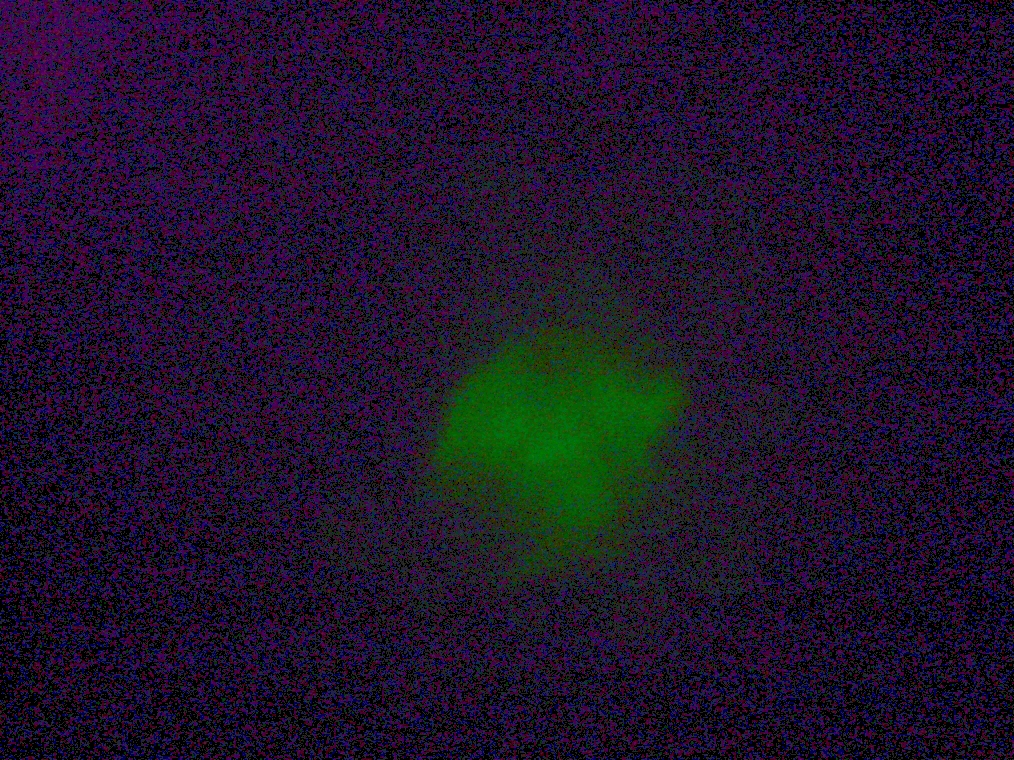
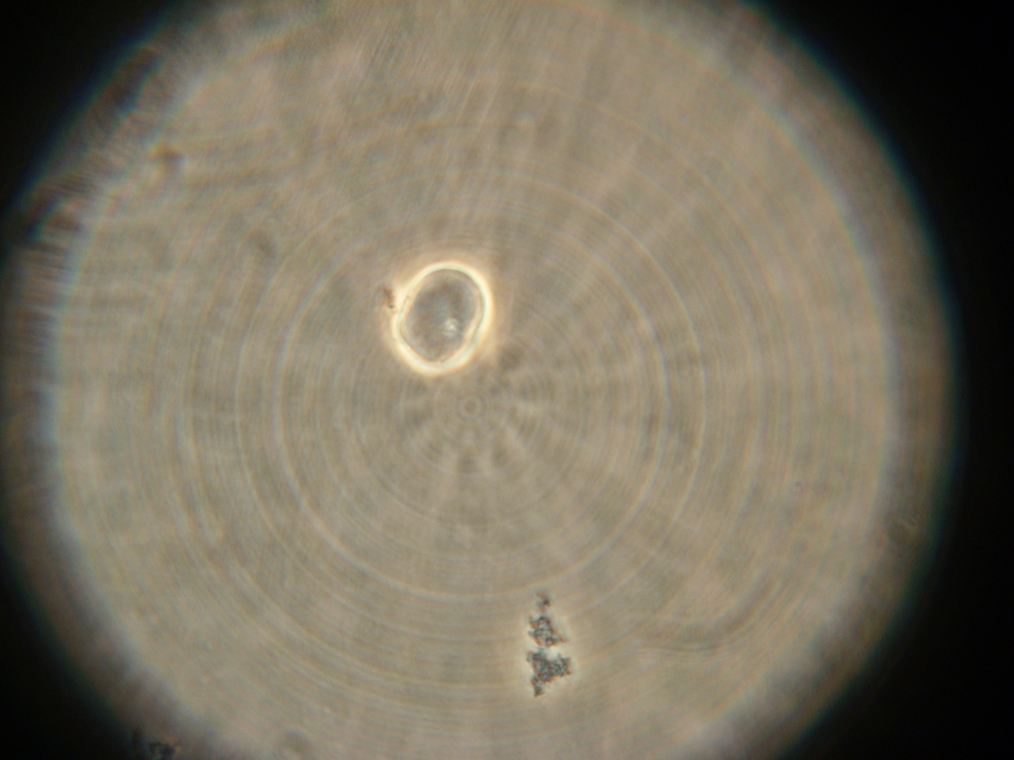
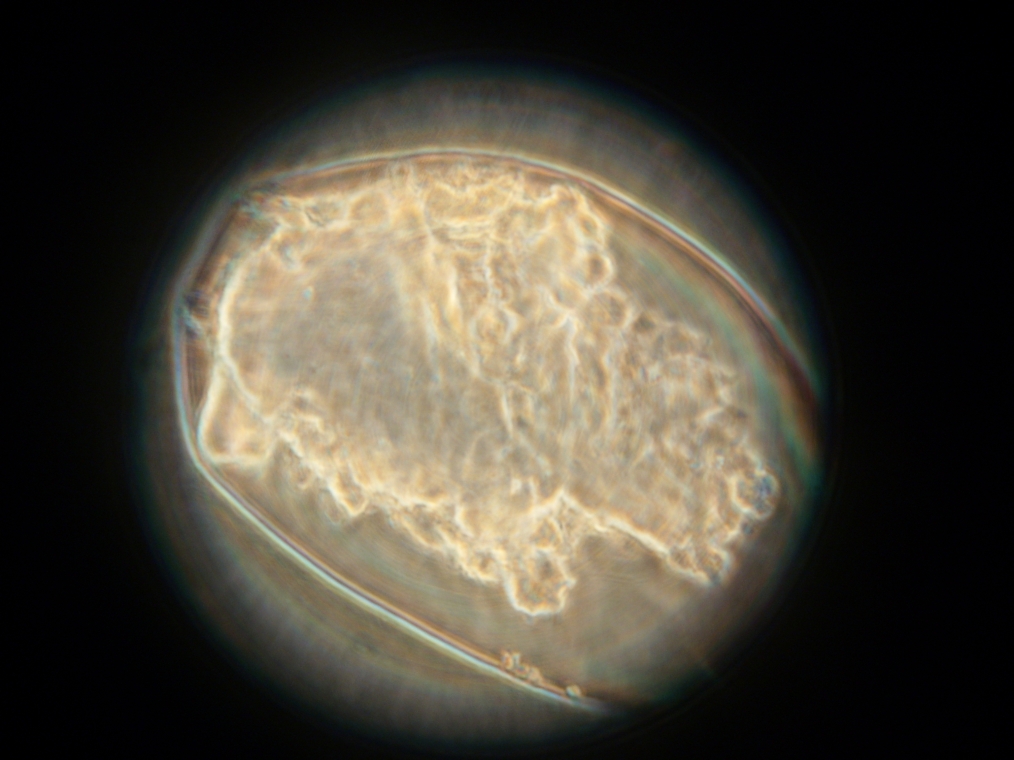
- Sample 10: Single large coalesced blob, with faint fluorescence, in spite of dense aggregate. No external aggregates.
- Sample 11: Many 2μm fluorescent vesicles, with very good enclosure - very few external aggregates. Large group of coalescence blobs.
Preparations
No preparations were made today.
|
| A strange texture found in Sample 2. It was not clear whether these 'dots' were in aqueous solution or a large air bubble under the slide cover. |
| 
|
| Pictures from Sample 3. Left: A large coalescence of vesicles, faintly fluorescent. Right: E.coli contamination from an unidentified source. | |
|
| An example of flocculated vesicles, found in Sample 5. The vesicles were faintly fluorescent. |
| 
|
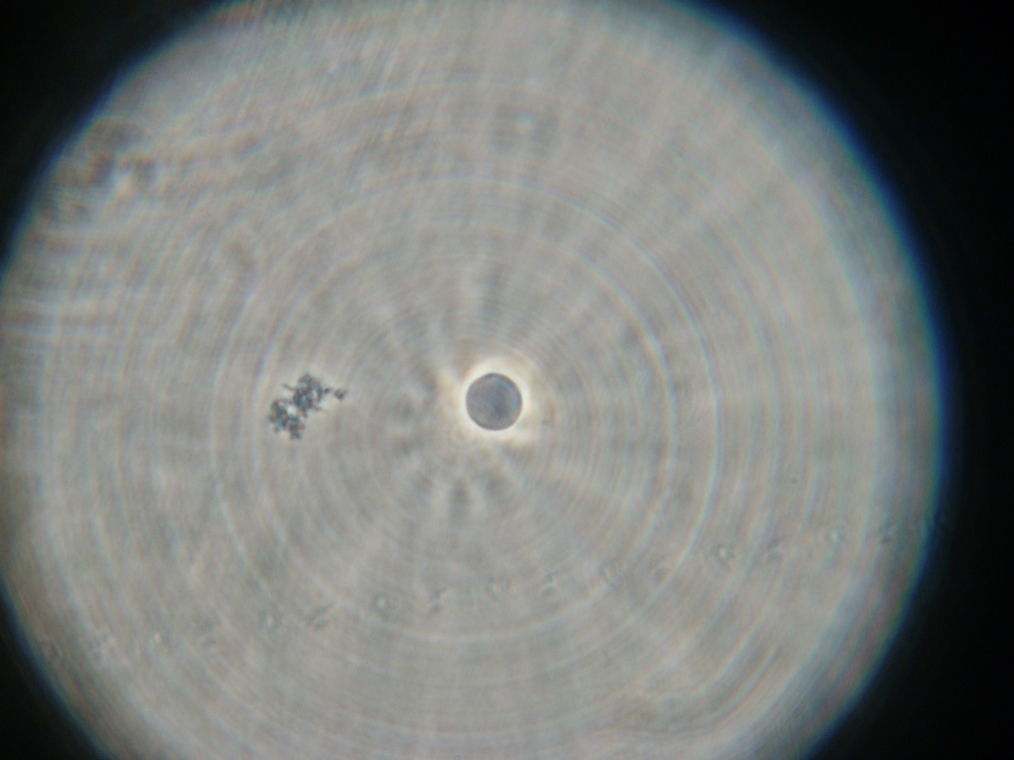
| Faintly fluorescent vesicles found in Sample 6. The fluorescence was too weak to be captured by the camera. | |
|
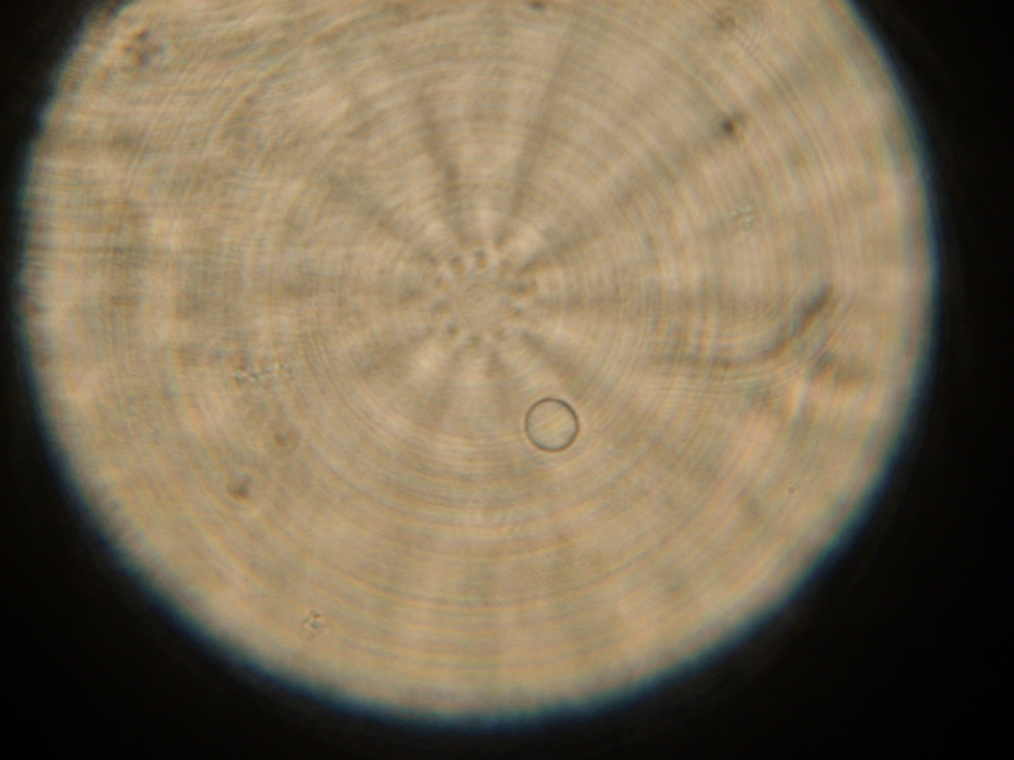
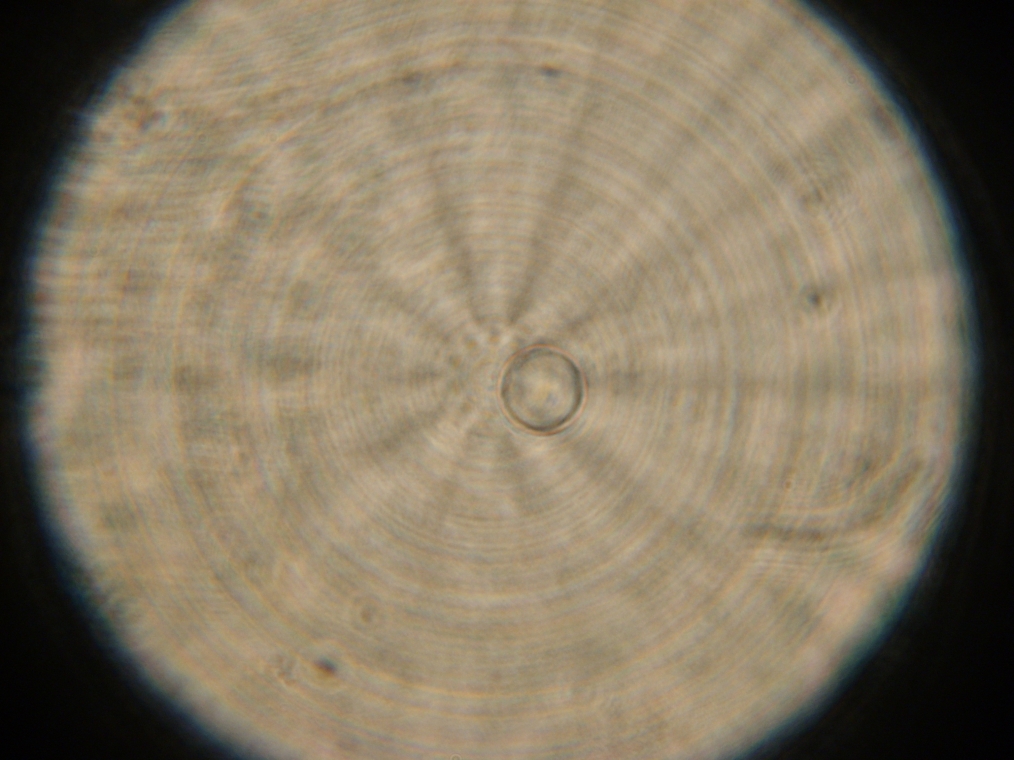
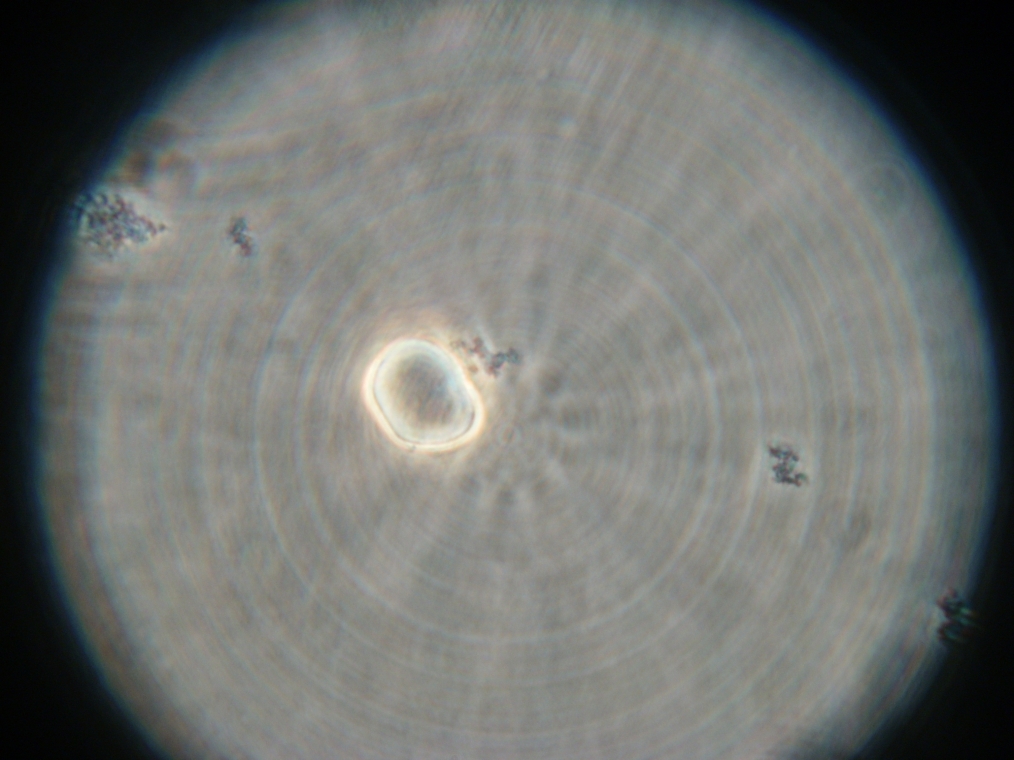
| One of the many fluorescent vesicles found in Sample 8. The fluorescence was too weak to be captured by the camera. |
|
| The single large coalescence blob, with faint fluorescence (in spite of dense aggregate) found in Sample 10. |
