Imperial/Wet Lab/Lab Notebook/2007-08-30
From 2007.igem.org
m (→Cell by date - Operating Temperature Range) |
m (→Vesicles) |
||
| (One intermediate revision not shown) | |||
| Line 50: | Line 50: | ||
Protocol can be found here under [http://www.openwetware.org/wiki/IGEM:IMPERIAL/2007/Experimental_Design/Phase2/Protocol_2.1.1 Phase 2-Operating Temperature Range] on the experimental design page. | Protocol can be found here under [http://www.openwetware.org/wiki/IGEM:IMPERIAL/2007/Experimental_Design/Phase2/Protocol_2.1.1 Phase 2-Operating Temperature Range] on the experimental design page. | ||
<br><br> | <br><br> | ||
| - | Results can be found here under [http://www.openwetware.org/wiki/IGEM:IMPERIAL/2007/Experimental_Design/Phase2/Results_2.1.1] on the experimental design page. | + | Results can be found here under [http://www.openwetware.org/wiki/IGEM:IMPERIAL/2007/Experimental_Design/Phase2/Results_2.1.1 Experimental_Design/Phase2/Results_2.1.1] on the experimental design page. |
==Degradation of GFP== | ==Degradation of GFP== | ||
| Line 64: | Line 64: | ||
==Vesicles== | ==Vesicles== | ||
'''Results''' | '''Results''' | ||
| - | Samples 1 through 5, prepared [[ | + | Samples 1 through 5, prepared [[Imperial/Wet Lab/Lab Notebook/2007-08-29|the day before]] were collected for observation under the microscope. The following results were obtained: |
* Vesicles were found in sample 1. | * Vesicles were found in sample 1. | ||
Latest revision as of 21:11, 26 October 2007

30 August 2007
Construction of pT7-GFP
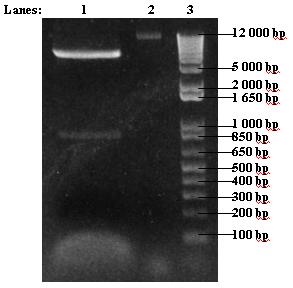
- Insert re-digest was run on 1% agarose gel
- 1. 30 μl insert re-digest
- 2. 5 μl uncut insert
- 3. 2 μl 1 kb DNA ladder
Protocols can be found at [http://www.openwetware.org/wiki/IGEM:IMPERIAL/2007/Notebook/General_Protocols#S30.2FS12_Cell_Extract#Electrophoresis Electrophoresis] in the general protocols page
- PCR purified vector digest
- Gel extract purified insert re-digest
Protocols can be found at [http://www.openwetware.org/wiki/IGEM:IMPERIAL/2007/Notebook/General_Protocols#S30.2FS12_Cell_Extract#DNA Extraction/Purification DNA Extaction/Purification] in the general protocols page
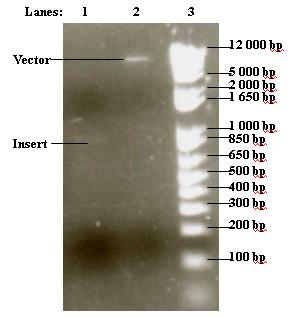
- Purified vector and insert were run on 1% agarose gel
- 1. 6 μl purified insert
- 2. 3 μl purified vector
- 3. 2 μl 1 kb DNA ladder
Protocols can be found at [http://www.openwetware.org/wiki/IGEM:IMPERIAL/2007/Notebook/General_Protocols#S30.2FS12_Cell_Extract#Electrophoresis| Electrophoresis] in the general protocols page
- Ligated vector and insert at 14°C overnight
- 7 μl purified insert
- 1 μl purified vector
- 1 μl T4 ligase
- 1 μl T4 ligation buffer
- A negative control with ddH20 instead of insert was also set up
Cell by date - Operating Temperature Range
Construct - pTet-GFP [http://partsregistry.org/Part:BBa_I13522 BBa_I13522]
Temperatures - 37 °C and 20°C
Aims: To test for the behaviour of the DNA construct (pTet) at temperatures 20oC and 37oC by observing the amount of fluorescence produced over a period of 24 hours.
- For each temperature two experiments carried out at staggered time points to minimize the time points not measured over night.
- Sampling was initially every 10 minutes however, this was reaccessed and changed to 20 and 30 minute time intervals.
- Measurements will carry on over tomorrow day to give ~30hours of measurements.
Protocol can be found here under [http://www.openwetware.org/wiki/IGEM:IMPERIAL/2007/Experimental_Design/Phase2/Protocol_2.1.1 Phase 2-Operating Temperature Range] on the experimental design page.
Results can be found here under [http://www.openwetware.org/wiki/IGEM:IMPERIAL/2007/Experimental_Design/Phase2/Results_2.1.1 Experimental_Design/Phase2/Results_2.1.1] on the experimental design page.
Degradation of GFP
- Tested GFP degradation at 37 °C and 20°C
- The tests were carried out on the same plate as the Operating Temperature Ranges and so the sampling was the same as that for the individual temperatures
- Measurements will carry on over tomorrow day to give ~30hours of measurements
Midiprep of Biobricks
- Midipreped sample left overnight in isopropanol was washed with 70% ethanol
Previous protocols can be found at [http://www.openwetware.org/wiki/IGEM:IMPERIAL/2007/Notebook/General_Protocols#S30.2FS12_Cell_Extract#Midiprep| Midiprep] in the general protocols page - Solution was dissolved in 300 µl of ddH2O
- Resulting concentration of DNA was 40 ng/µl (lower than expected!)
Vesicles
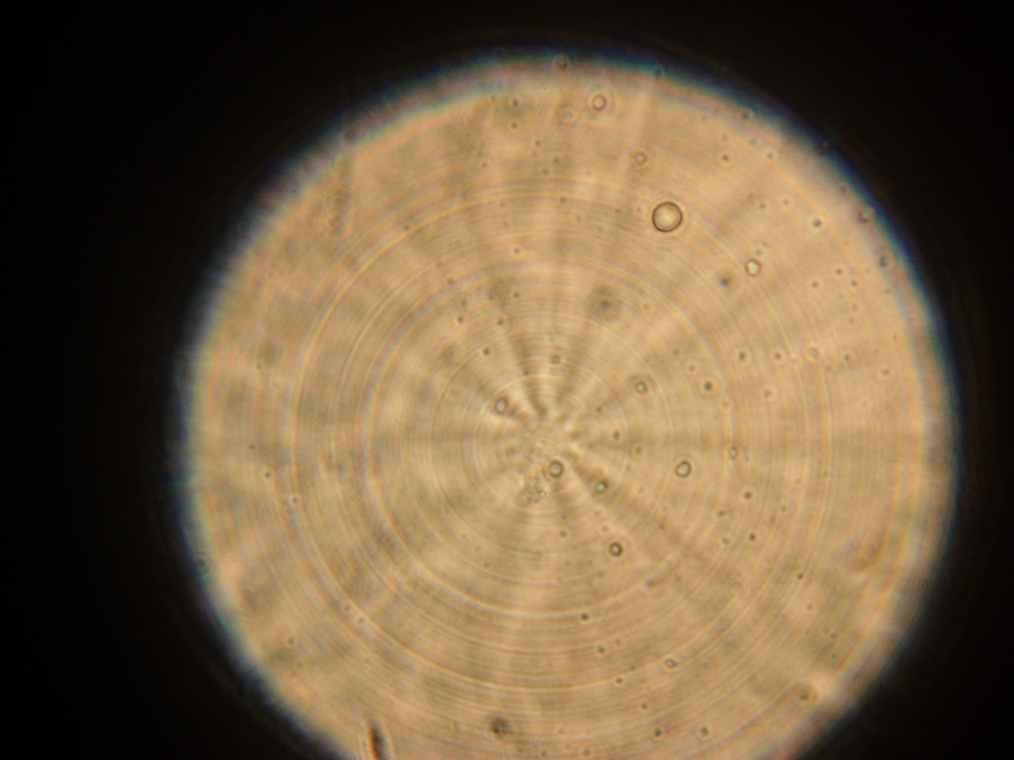
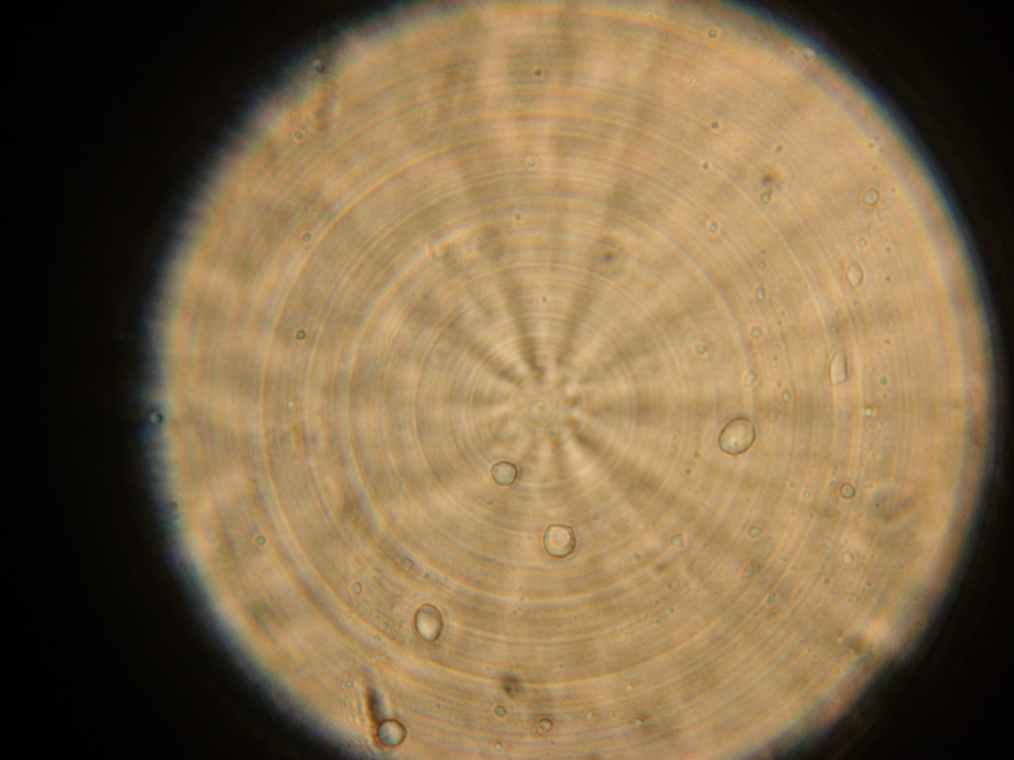
Results Samples 1 through 5, prepared the day before were collected for observation under the microscope. The following results were obtained:
- Vesicles were found in sample 1.
- A single vesicle was found in sample 2.
- No vesicles were found in samples 3-5, in spite of the presence of many GFP aggregates.
